Overview of Power Automate Process Mining

The latest feature in Power Platform enables process mining techniques in Microsoft 365. This article explains what process mining is and describes its main features and functions. It includes a quick guide about how to start working with the Power Automate Process Mining service.
What Is Process Mining?
Process mining merges process analysis with data-centric techniques. It takes disciplines from processes (such as business process management, process optimization, formal methods, process automation, and process improvements) and from data science (such as statistics, algorithms, data mining, predictive analysis, and behavioral science).
It uses events from the business process (not diagrams or ideal scenarios) and, based on that, produces meaningful information about the process. For example, you can take logs from a cost invoicing process (from your SAP system) and analyze them using process mining techniques. You will get:
- A real process map with steps and step durations.
- A map with mapped resources and connections between them.
- All paths used in the process (with loops, dead-ends and errors).
- Information about bottlenecks.
You can use this information to answer common questions:
- What are the most frequent paths in the process?
- Where are the main bottlenecks in the process?
- Which invoices deviate from the reference business process?
Using process mining, you can check your business process, find issues and bottlenecks, implement changes, and then analyze the optimized process again to check if the issues are resolved. You can also use it as a feedback loop to optimize business processes and introduce new features.
That’s just a basic feature—process mining tools offer more advanced features and functions. For example, you can enhance process compliance based on the current analysis, predict if changes will improve the process, and find hidden patterns and paths.
That’s not all—you can also use process mining tools to discover informal processes. Tools can record users’ actions and generate paths and connections between users and tasks. You can even combine those two techniques and merge logs from a business process system with recorded tasks. As a result, you will get full information about the process with formal and informal parts.
What Is Power Automate Process Mining?
In August 2023, a feature was released as an add-on to existing Power Automate licenses, which is designed based on process mining techniques and paradigms. Microsoft acquired Minit, a Slovakian process mining company founded in 2015 and used the knowledge and services from the Minit tool to create a specialized service in Power Platform.
Licensing options for Power Automate include:
- Power Automate trial license: You can enable a trial license for 90 days, which is long enough to test all features and even understand your live business process. This version gives you 100 MB of data per process, which should be enough for testing purposes.
- Power Automate Premium license: This license gives 50 MB of process mining capacity to a tenant-wide capacity pool, up to 100 GB. When you reach 100 GB, you need to purchase the Power Automate Process Mining add-on.
- Power Automate Process Mining add-on: The add-on is a tenant-wide license that is available for the Power Automate Premium license. It gives you 100 GB of storage for processing data. The add-on costs $5,000 per tenant/month.
Main Features
The main features of Power Automate include:
- Process mining: Connect your existing data from your systems, analyze that data, visualize a process map, and understand business processes across your organization.
- Task mining: This feature gives you opportunities to understand how your employees work. Record the users’ actions, visualize a process map, and understand the real business process behind daily tasks or routines.
Prepare and Analyze Sample Data
In this section, I will show you how to upload sample data and analyze it. You can use sample data from Microsoft or upload your own data logs from a business application.
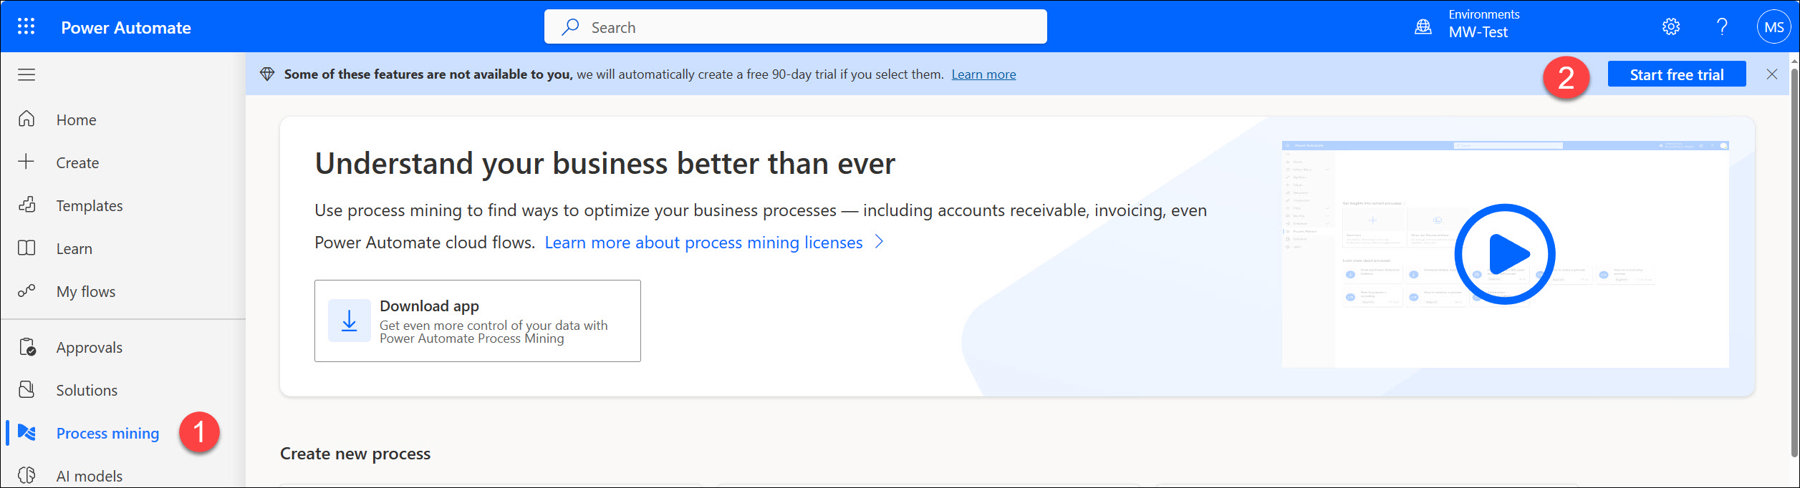
To enable a trial version, go to the Power Automate portal (https://make.powerautomate.com/), select the Process mining section (1) in the left-hand navigation, and then select Start free trial (2).
The first step to start working with Power Automate Process Mining is to upload and prepare data. As mentioned, you can use a sample file prepared by Microsoft (https://learn.microsoft.com/en-us/power-automate/process-mining-tutorial#download-the-sample-data) or use your own data.
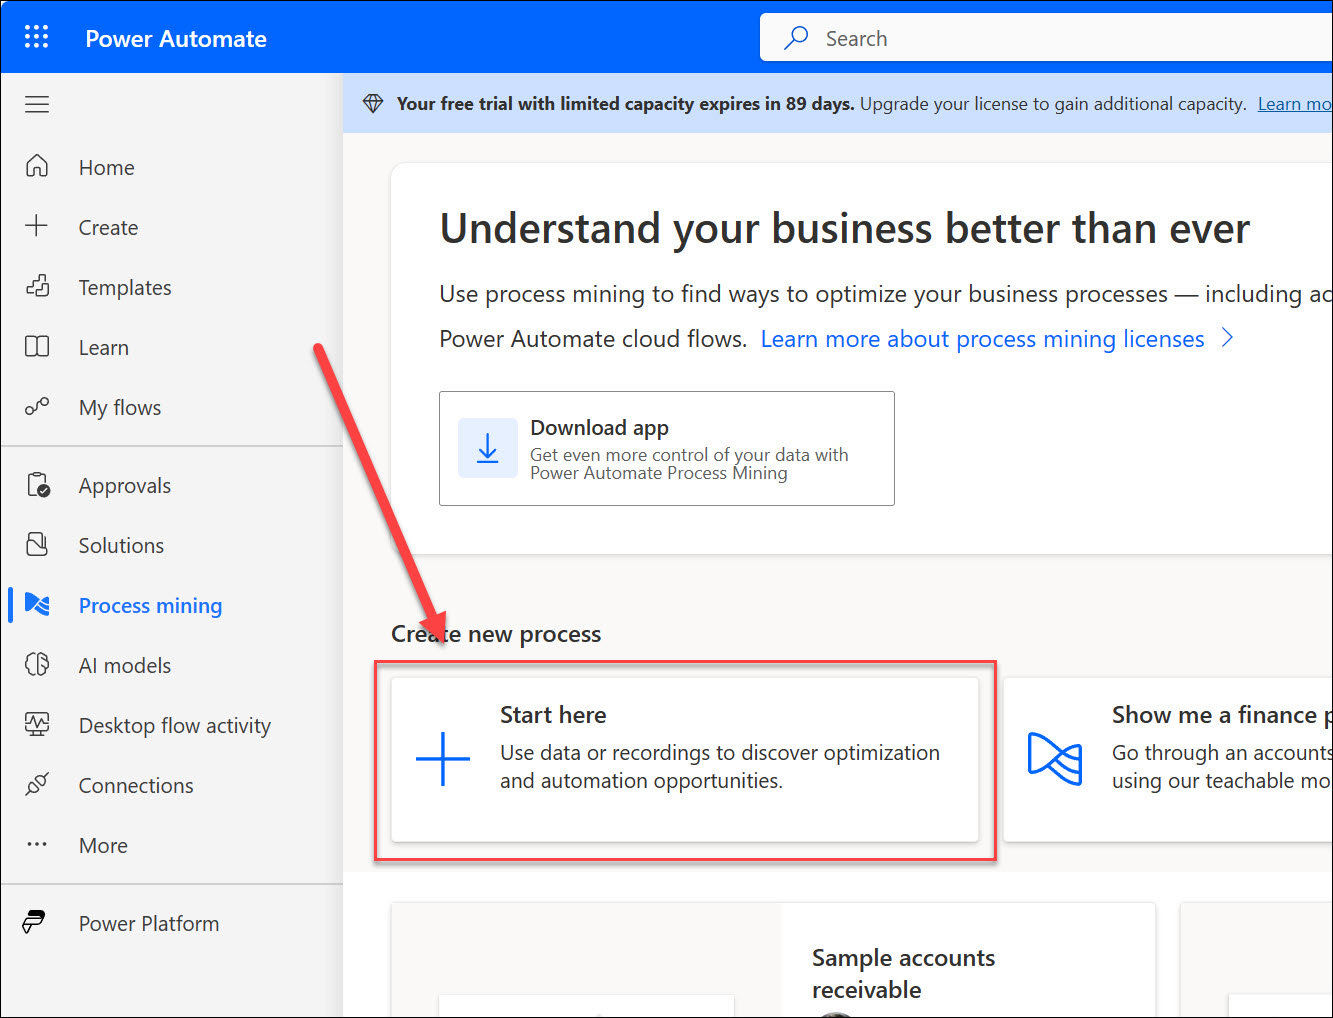
Open the Process Mining section and select Start here.
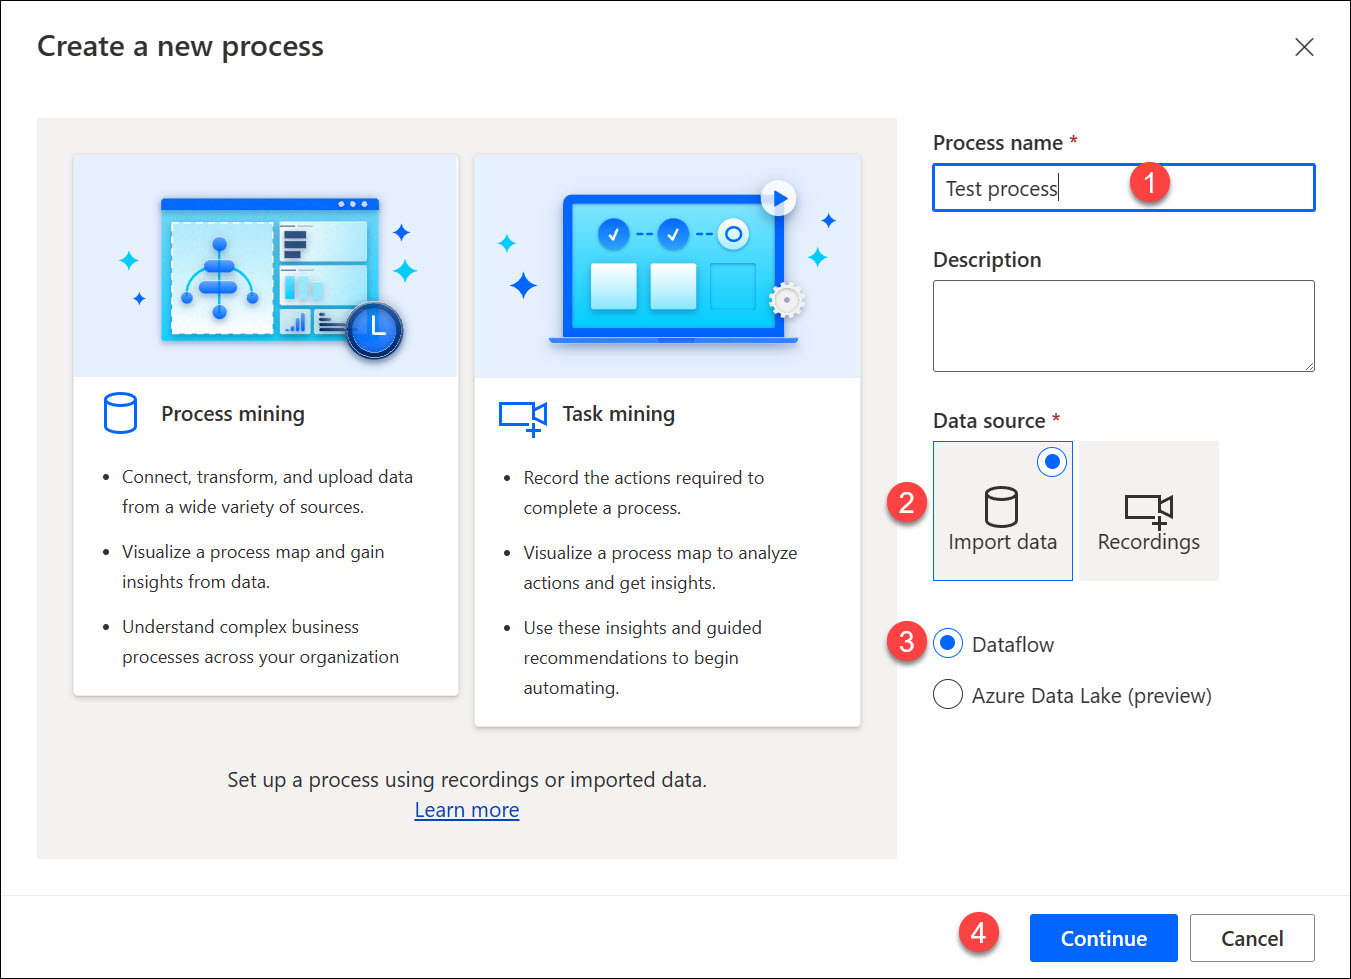
Enter a process name (1), select Import data (2) as a data source, select Dataflow (3), and then select Continue.

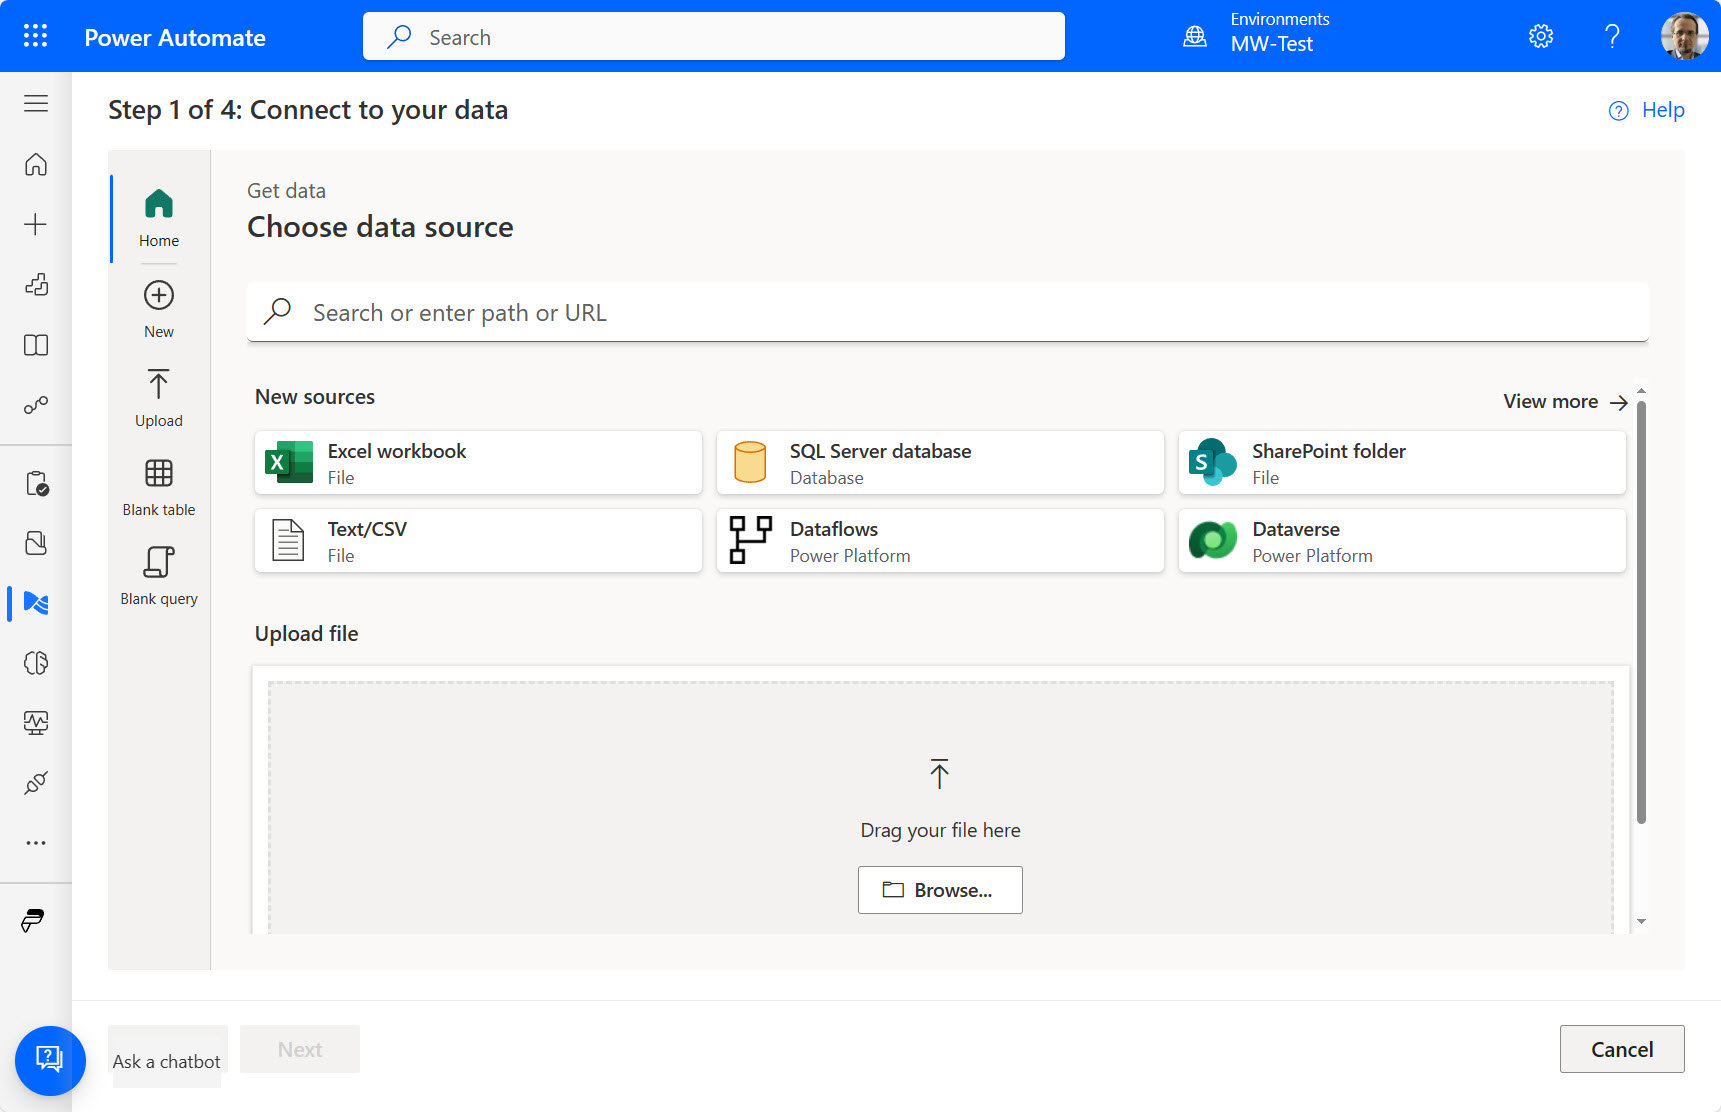
There are many data sources that you can use to upload your process data. The sample file is in CSV format, so choose Text/CSV.
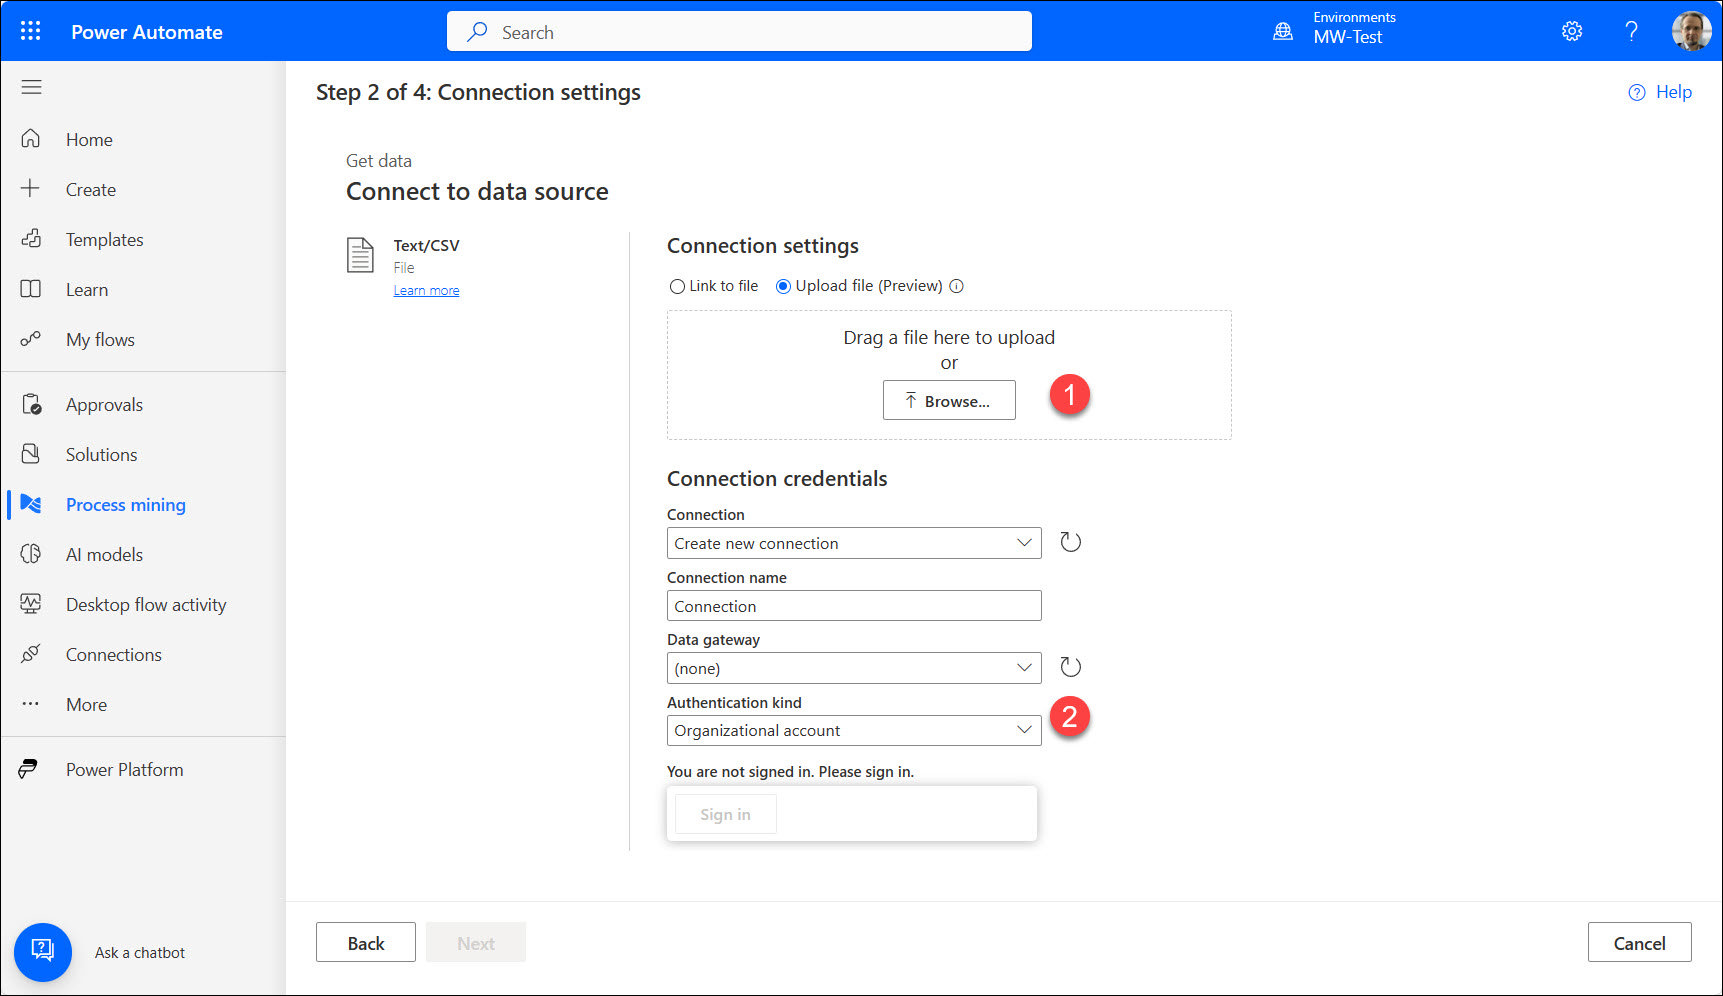
On the next screen, you can upload the sample file (1). The next step is to configure a connection (2) to your organization. (It’s available when you upload a file.)
On the next two screens, you can review your data, update data types, or make additional transformations. If everything looks OK, select Next. Map your data to the three fields that the Process Mining tool requires:
- Case ID: ID of the activity (for instance, Invoice ID processed by the system)
- Activity: The name of the activity (for instance, Registering a new invoice, Invoice check)
- Event Start: The time the activity started
There are also two optional fields that you should map if possible:
- Event End: The time the activity ended
- Resource: Who did the action (for example, who processes the invoice in the current stage)
If you have any other data (for example, location, financial data, roles, department name, and manager), you can map them using Case and Event attributes:
- Case Level Attribute: Data related to a case (for example, location or vendor name)
- Event Level Attribute: Data related to an event (for example, user’s role)
- Financial per Case: Financial information about a case (for instance, contract value)
- Financial per Event: Financial information about an event (for instance, discount given by a user)
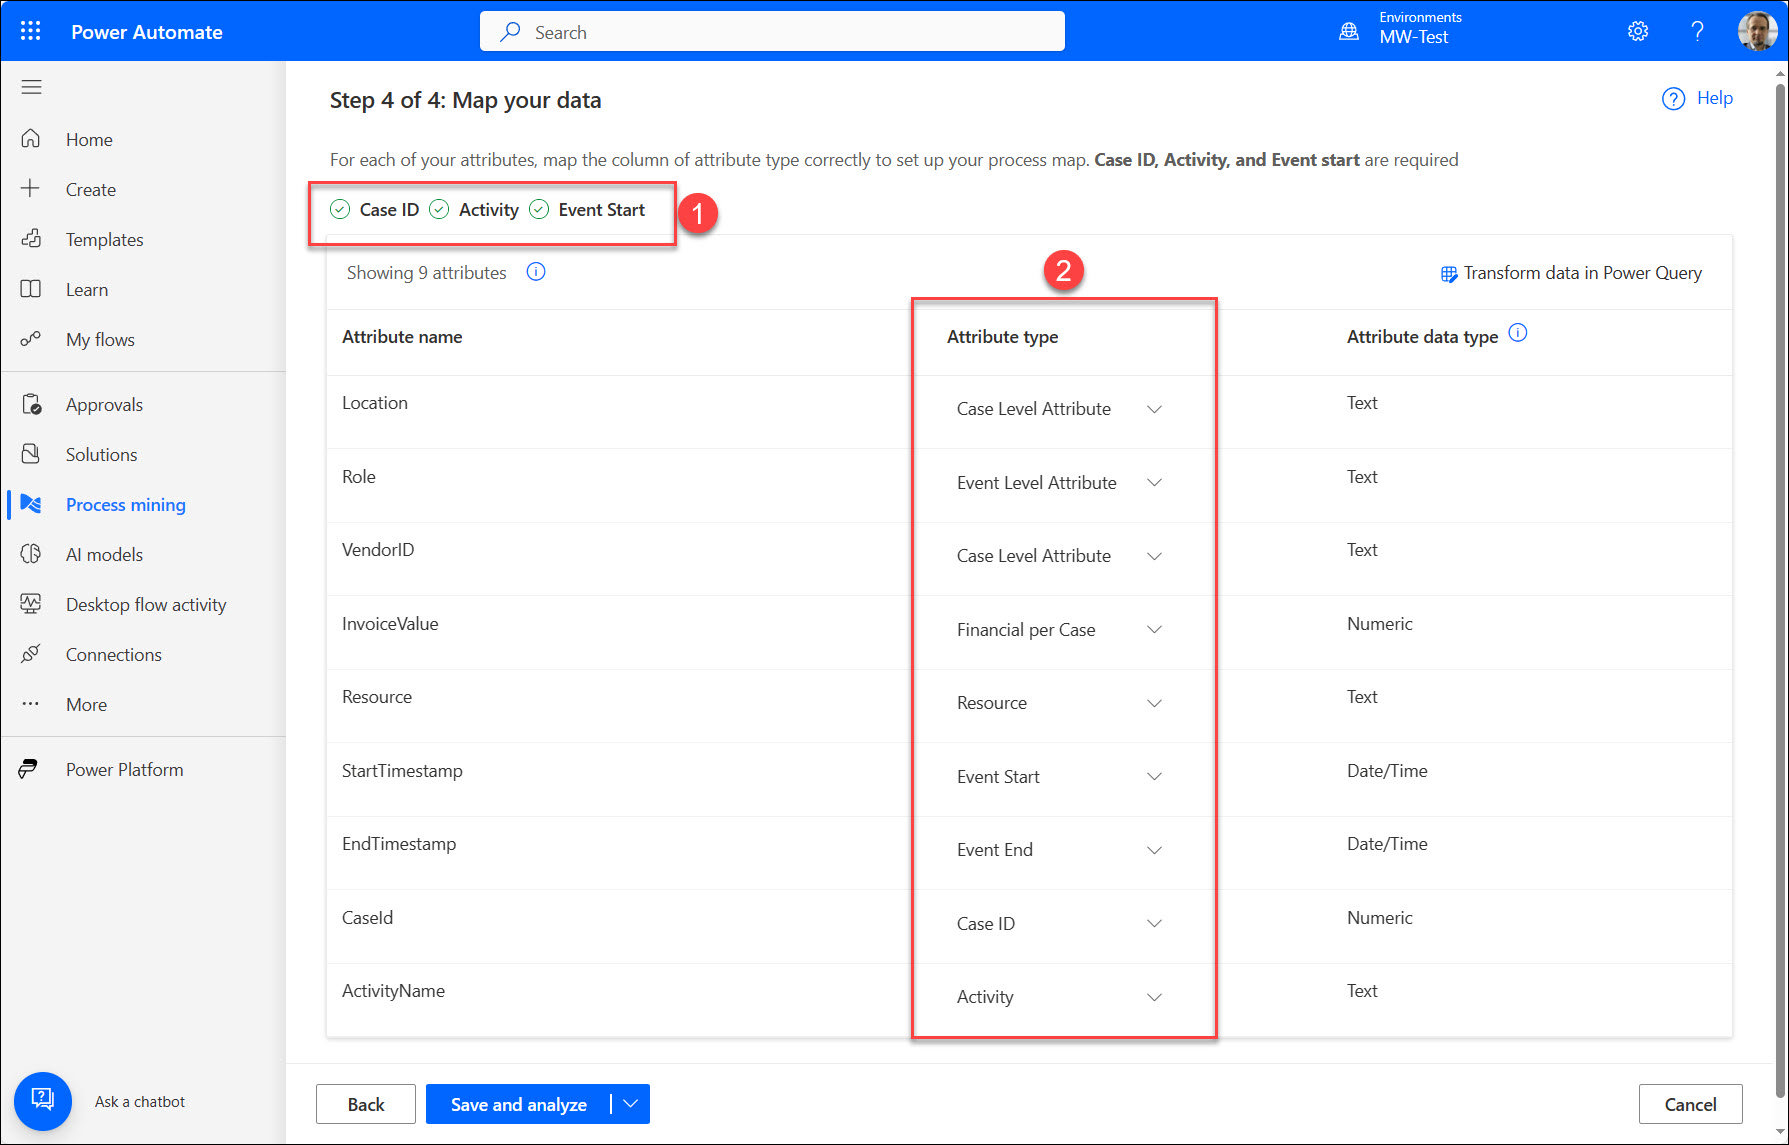
If you map all required fields, the tool will mark them with a green check icon (1). You can review any other fields and map them in Attribute type (2). When you finish, select Save and analyze. The process mining algorithms will do their job and give you results after a few minutes (depending on the data size).
Understand Analyzed Process
When Process Mining finishes analyzing your data, you will get a report with basic information about your process.
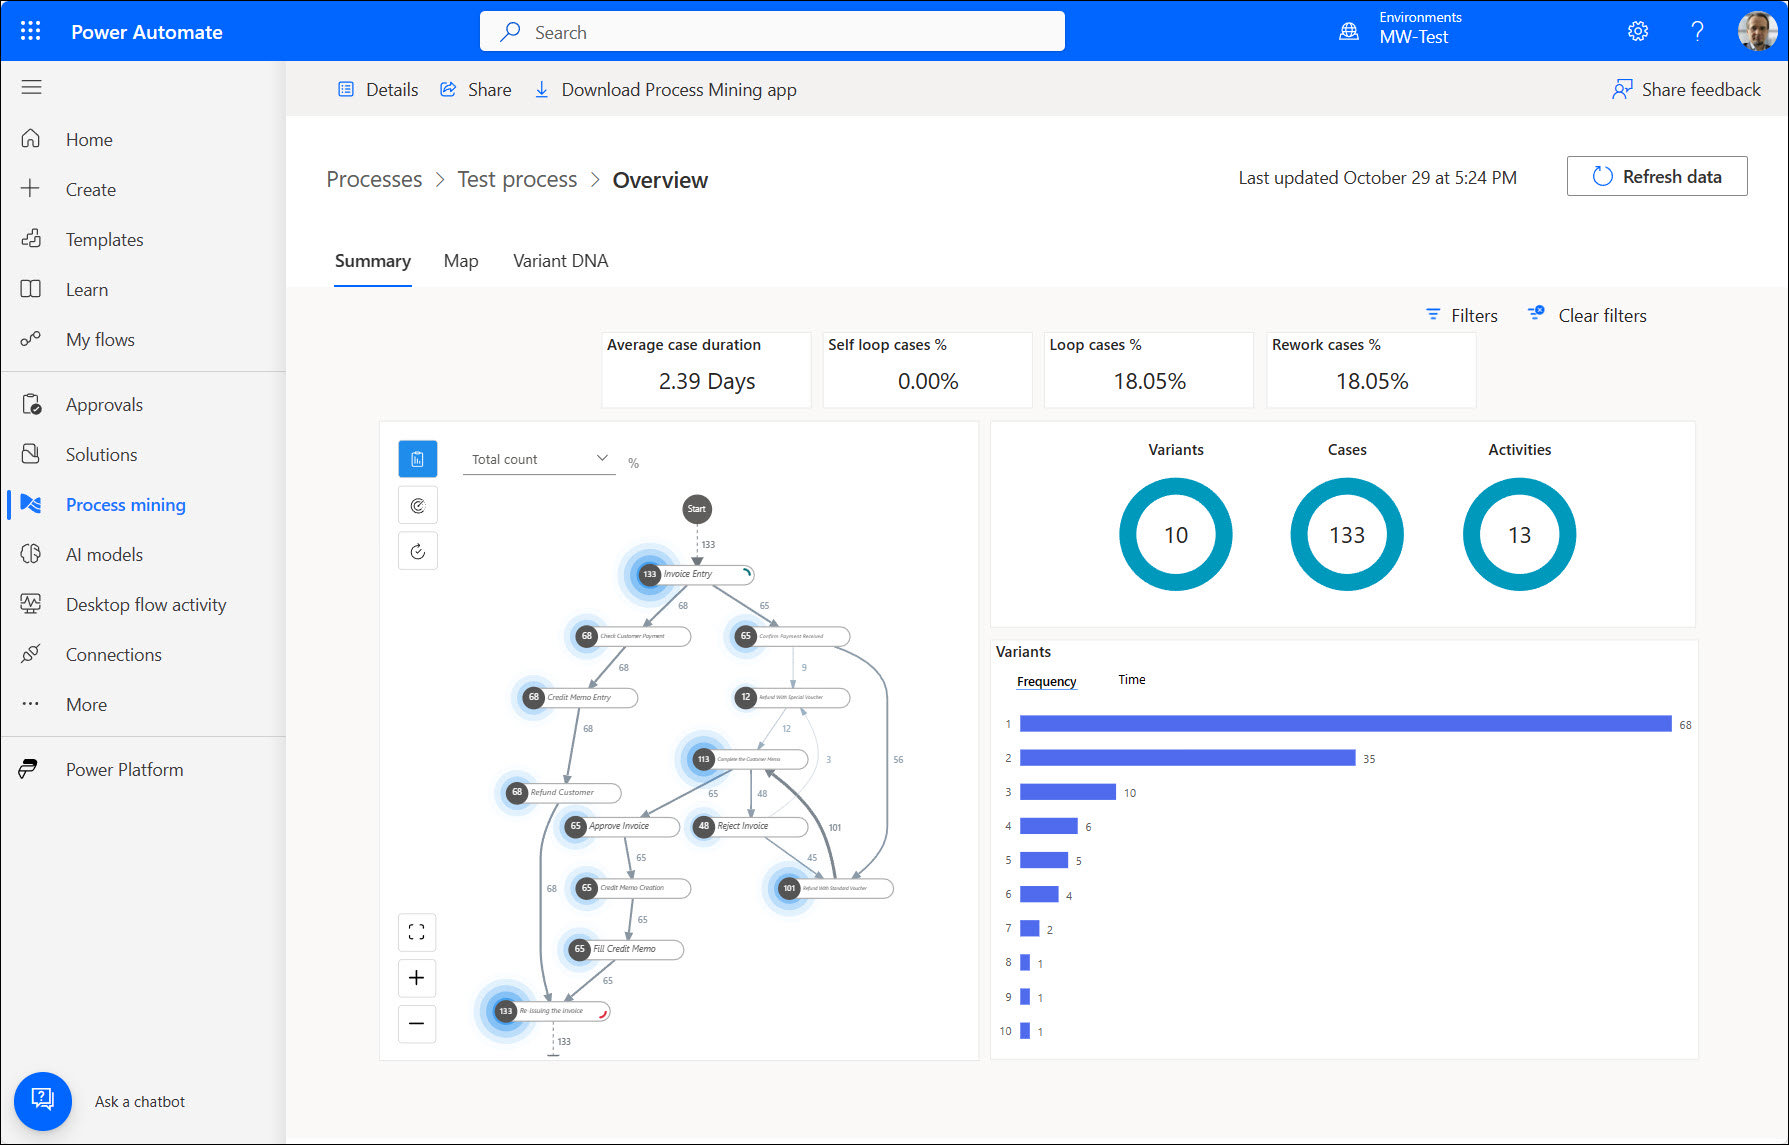
In the overview report, there is information about average case duration, loop statistics, variants, and more. Using the data, you can check if your processes are healthy, identify if there are bottlenecks and where, and determine how many process paths are in use. Based on the report, you can optimize your business process and repeat the whole analysis to see if it helps.
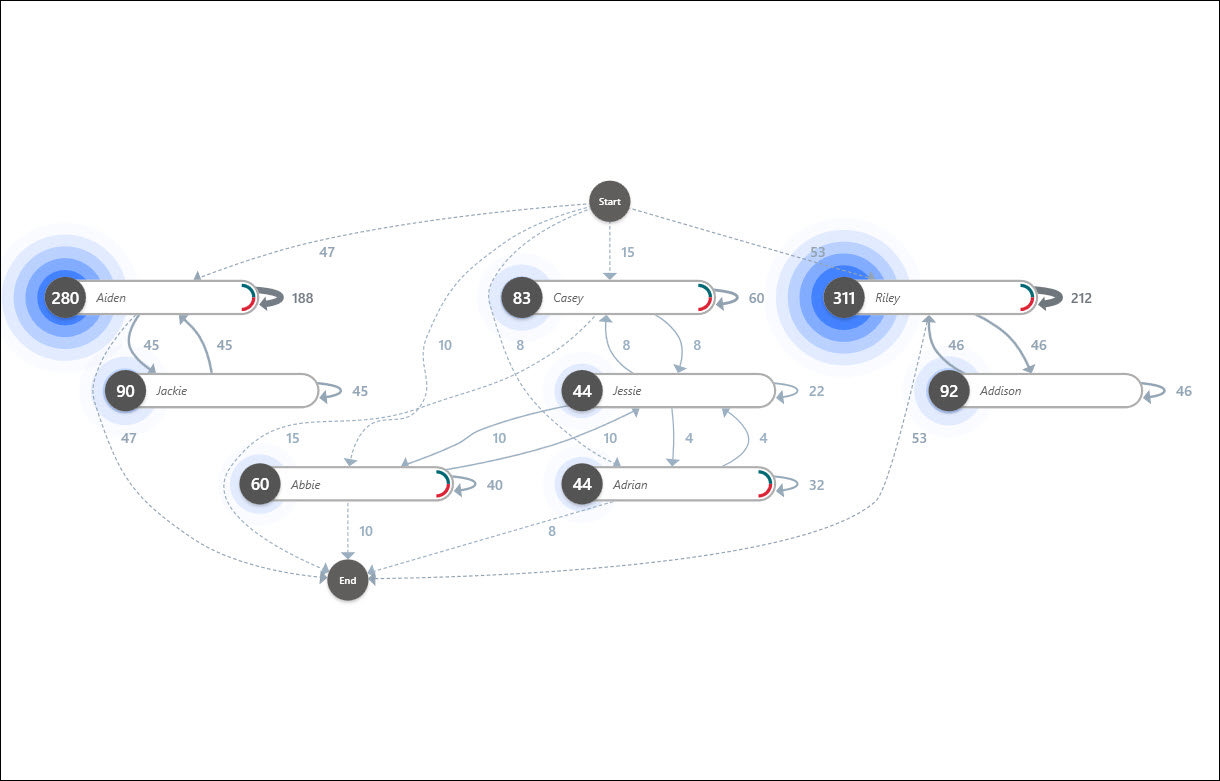
Process map activities (also known as nodes) represent activity or unique values of different selected mining attributes (such as Resources) executed in the process. The size and color of the highlight (also known as the halo effect) expresses the total proportion of the frequency in relation to the other nodes.
How to Work with the Desktop Application
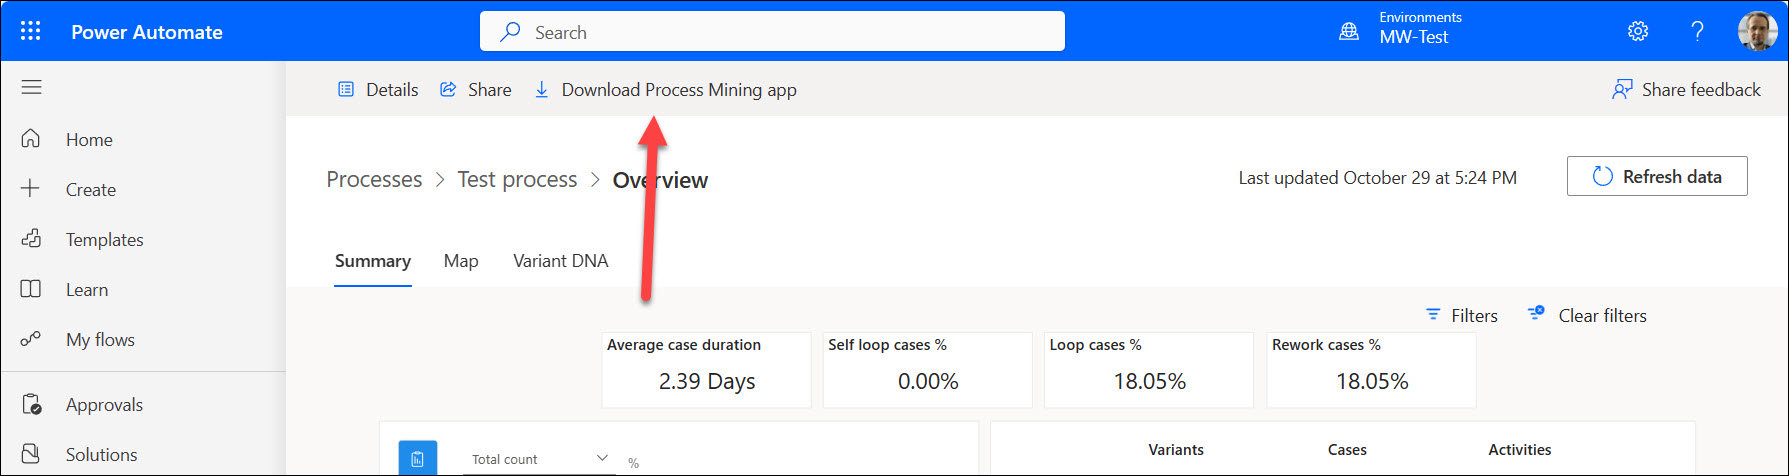
The web report is not all that you can get from Process Mining. There is a dedicated desktop application that gives more detailed reports and much more data about the process. To install it, select Download Process Mining app at the top of the page.
Open the app and sign in using your Microsoft 365 credentials. In the app, you can see all projects created in the web versions. Select the one that you created.
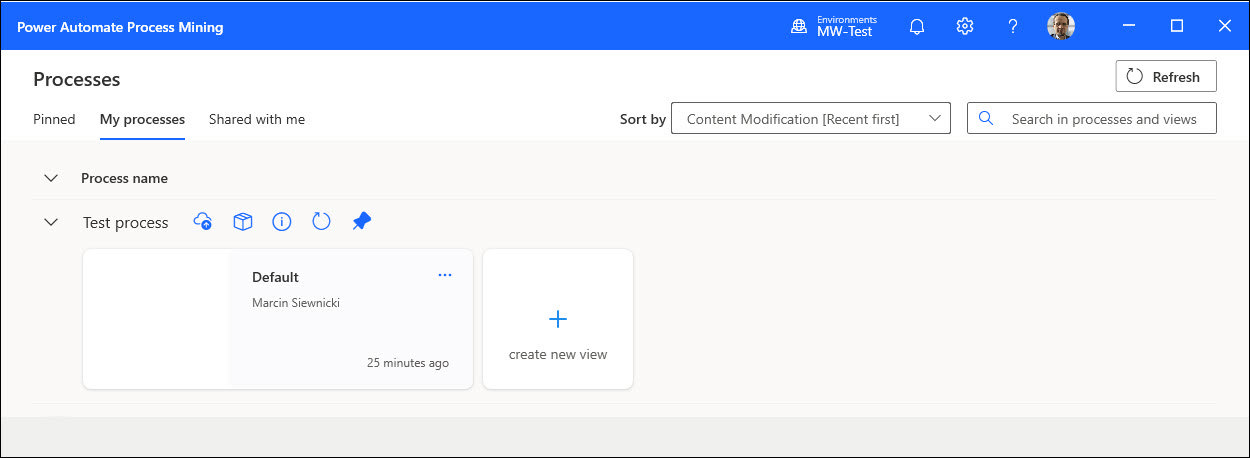
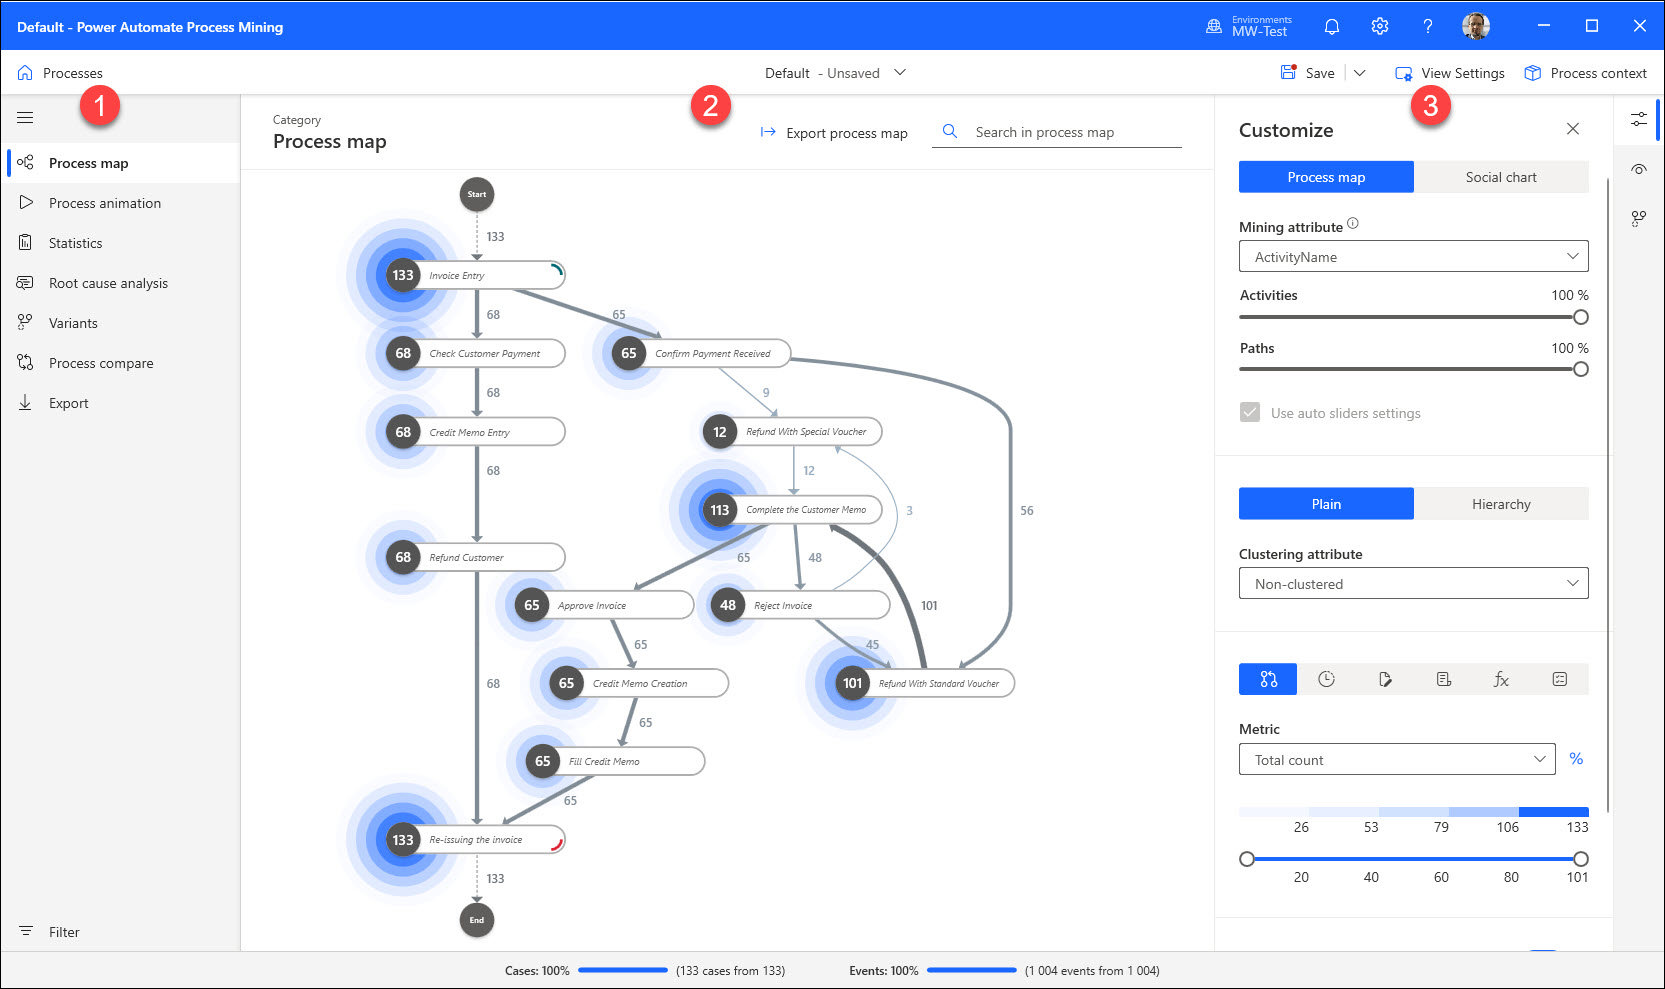
The app shows you the map of the process (the same as in the web version), along with much more information and options. The window is divided into three sections:
- Left-hand navigation with sections (1)
- The main screen with diagrams (2)
- The filter pane (3)
Available Options in the Desktop Application
The desktop app gives you the following options:
- Process map: Diagram of the process with filters. Depending on the selected data, you can check the process map by Activity, Resource, and Role. Each view gives you a different perspective of the process.
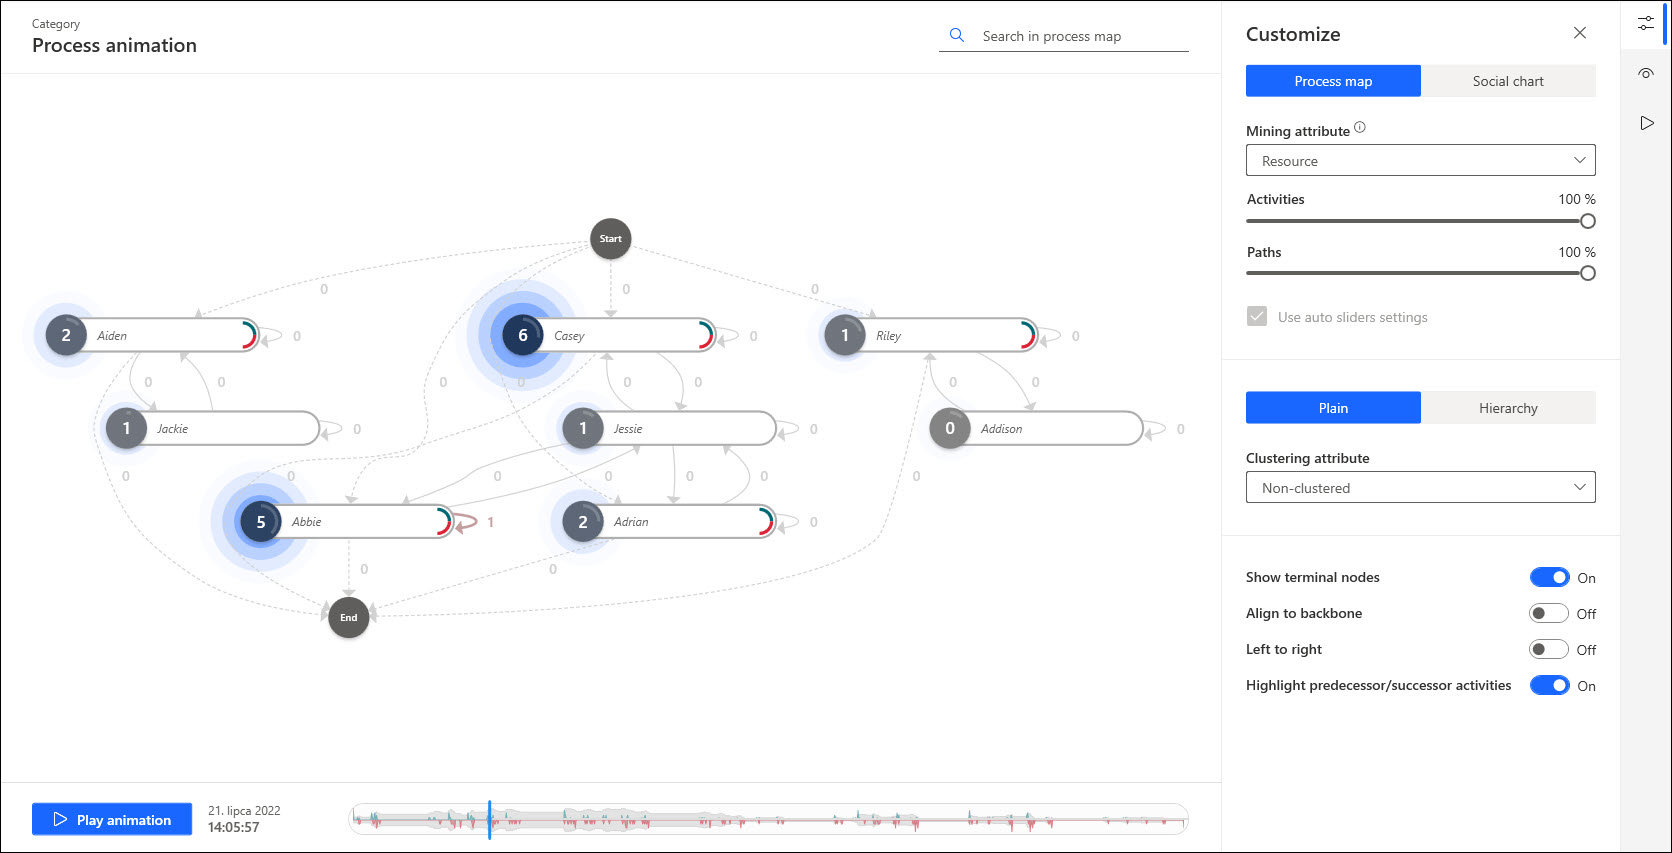
- Process animation: You can visualize process development over time, in addition to controlling animation speed, diagram type, and mining attributes.
- Statistics: Statistical information about your process. You can view the Case overview report with basic metrics, Activity statistics, Case duration influences, and much more.
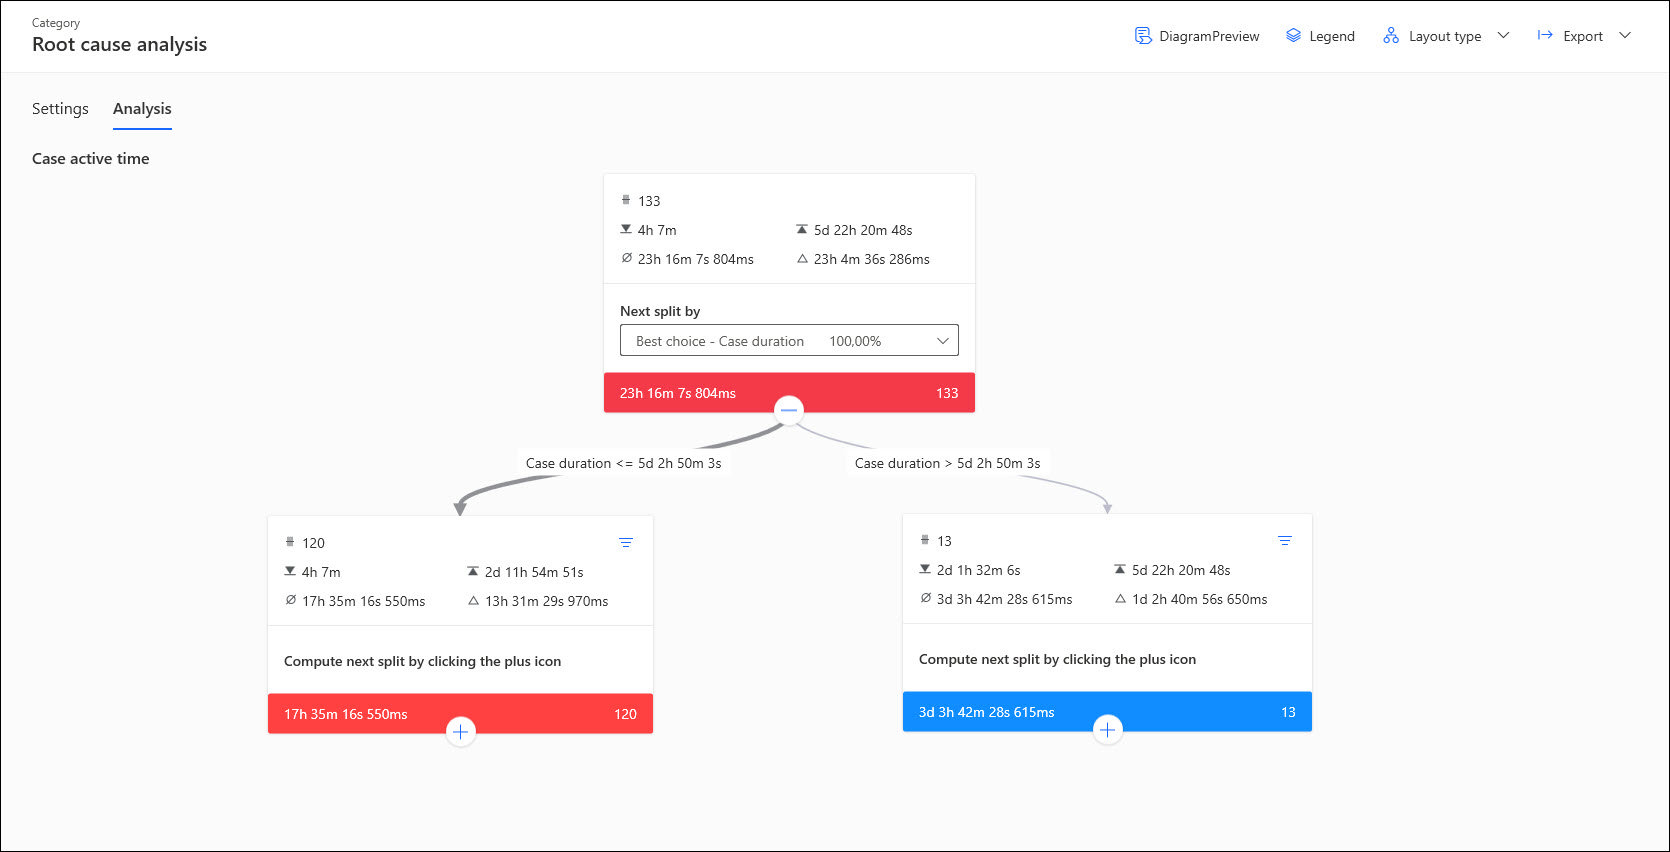
- Root cause analysis: Root cause analysis enables you to find hidden connections in your business process data. For example, you can discover why some agreements take longer to complete than others.
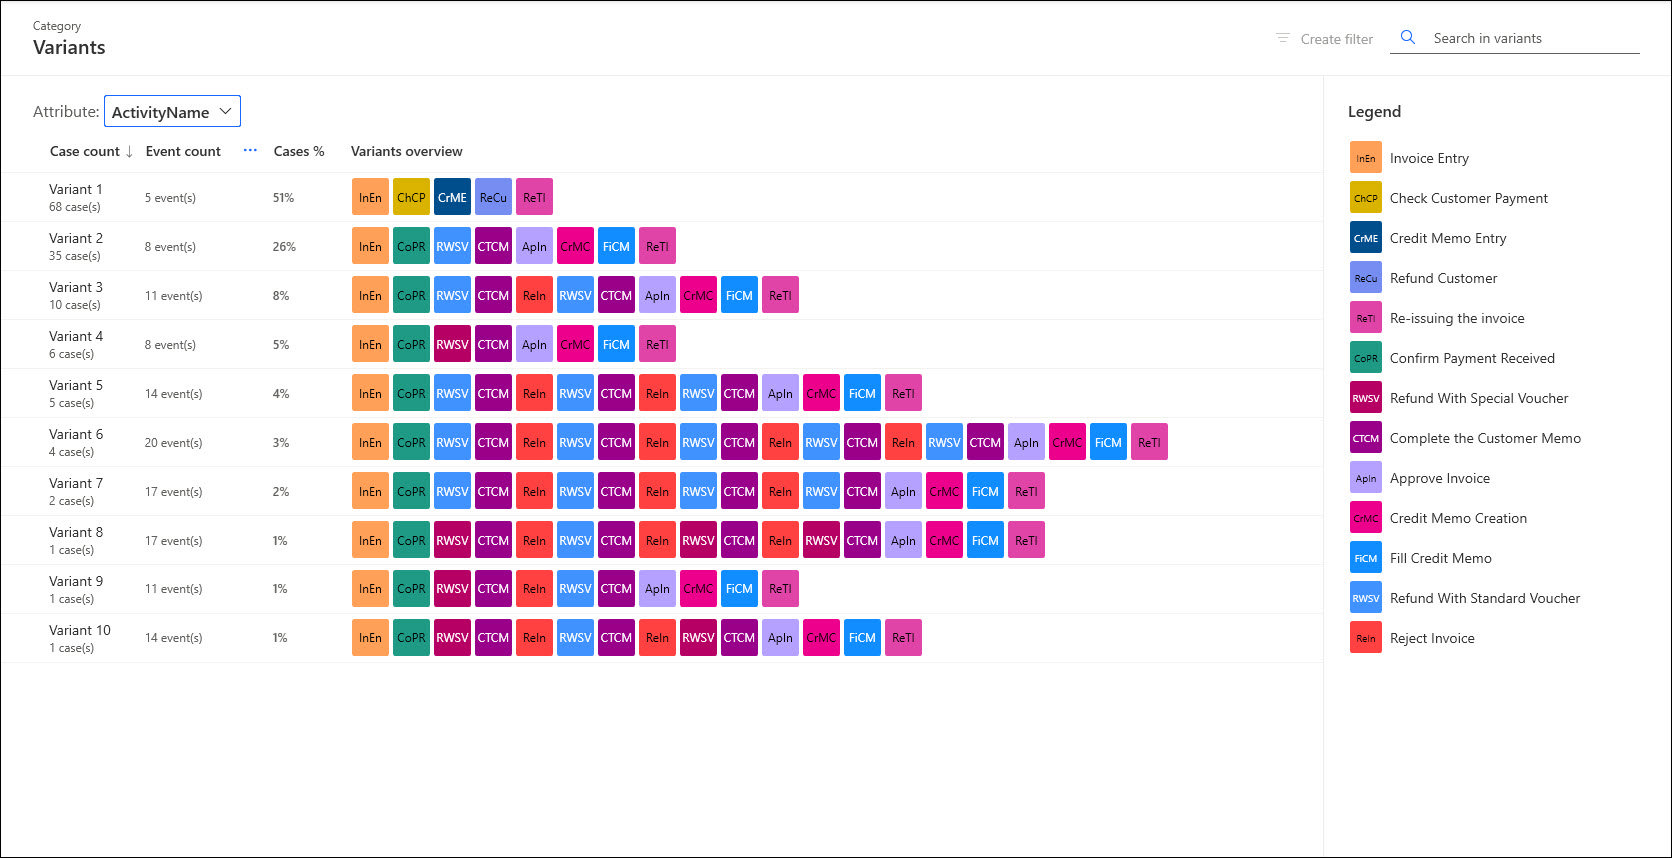
- Variants: Process variants show all possibilities of how a process can develop. Using this information, you can identify problematic scenarios.
- Process compare: This feature allows you to add a BPMN layer and compare the idealization of the process with real data, based on users’ activities.
Summary
The information that you can discover using the Power Automate Process Mining tool gives you multiple ways to find bottlenecks, discover real process paths, understand connections between users and process parameters, and much more.
The tool is universal. All you need to do is gather data from your line-of-business applications, which can be from SAP systems, customer relationship management (CRM) systems, financial apps, HR platforms, fully custom services, and more. You can set up a connection between your system and the Process Mining tool to continuously analyze data and make improvements.
The sample scenario that I presented is just a glimpse of what is possible with this tool. You can map more data to discover additional information from your processes. You can even combine it with AI or machine learning algorithms to predict users’ behavior and the impact of your changes to the process.

Marcin Siewnicki
Marcin Siewnicki is a Microsoft 365 consultant and architect. His IT adventure started in 2005. Since then he’s been creating and implementing business applications based on SharePoint and Microsoft 365 platforms. He is a big fan of tasks and process automation (Power Automate) and Modern Workplace platforms (Microsoft Teams).
Privately Marcin is a husband and father of two sons. He is a fan of science fiction and cyberpunk and is a futurist. Marcin is co-organizer of the CollabDays Poland conference and speaker at Microsoft’s community events.