How to Use Message Trace to Track Microsoft 365 Emails

Undelivered emails pose a problem both for administrators and the sender of the mail. Message trace within the Microsoft Exchange admin center (EAC) helps you get to the root of this issue to find out why the message was not delivered. Was it a server issue or some mail flow rule that stopped the message? Or was the email wrongly labeled as spam? Whatever the reason, running a message trace can help you find the cause.
You can run a message trace using the EAC or Windows PowerShell. I’ll be discussing both these methods in this article.
Prerequisites
You should have Global Administrator or Exchange Administrator rights.
How to Get to Message Trace in the Exchange Admin Center
You can either:
- Click https://admin.exchange.microsoft.com/#/messagetrace and directly land on the Exchange admin center.
OR
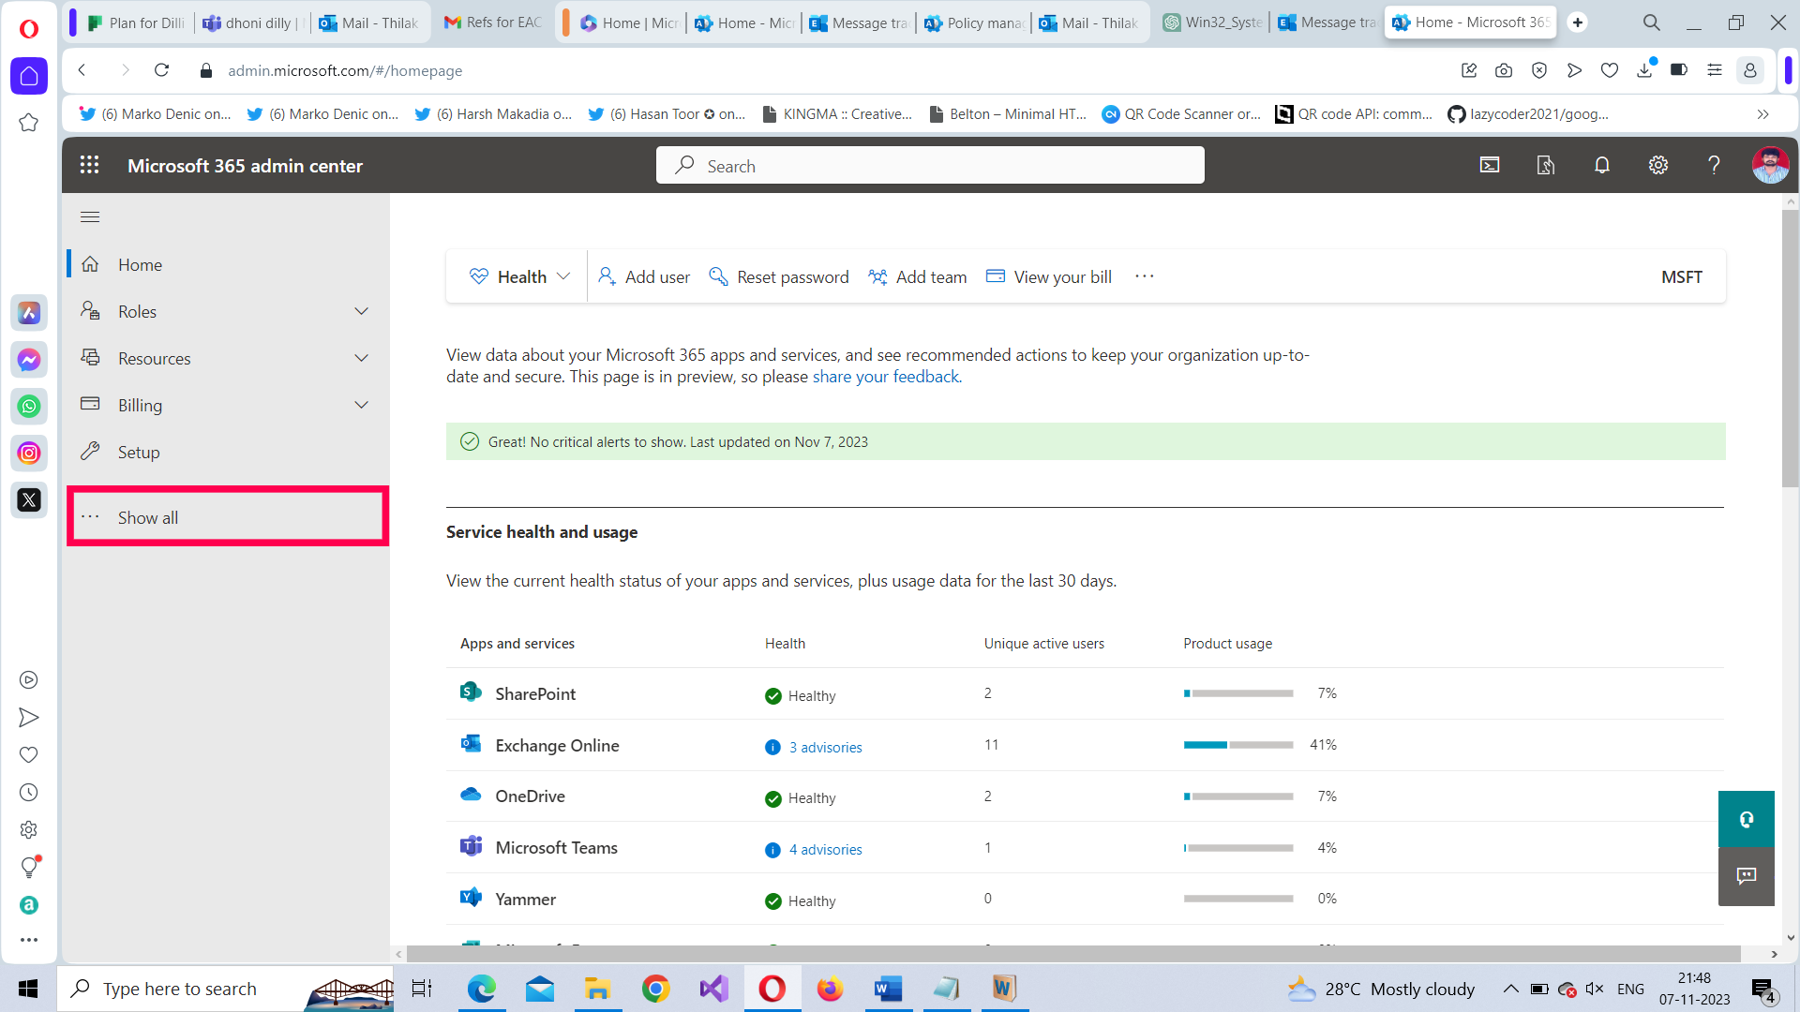
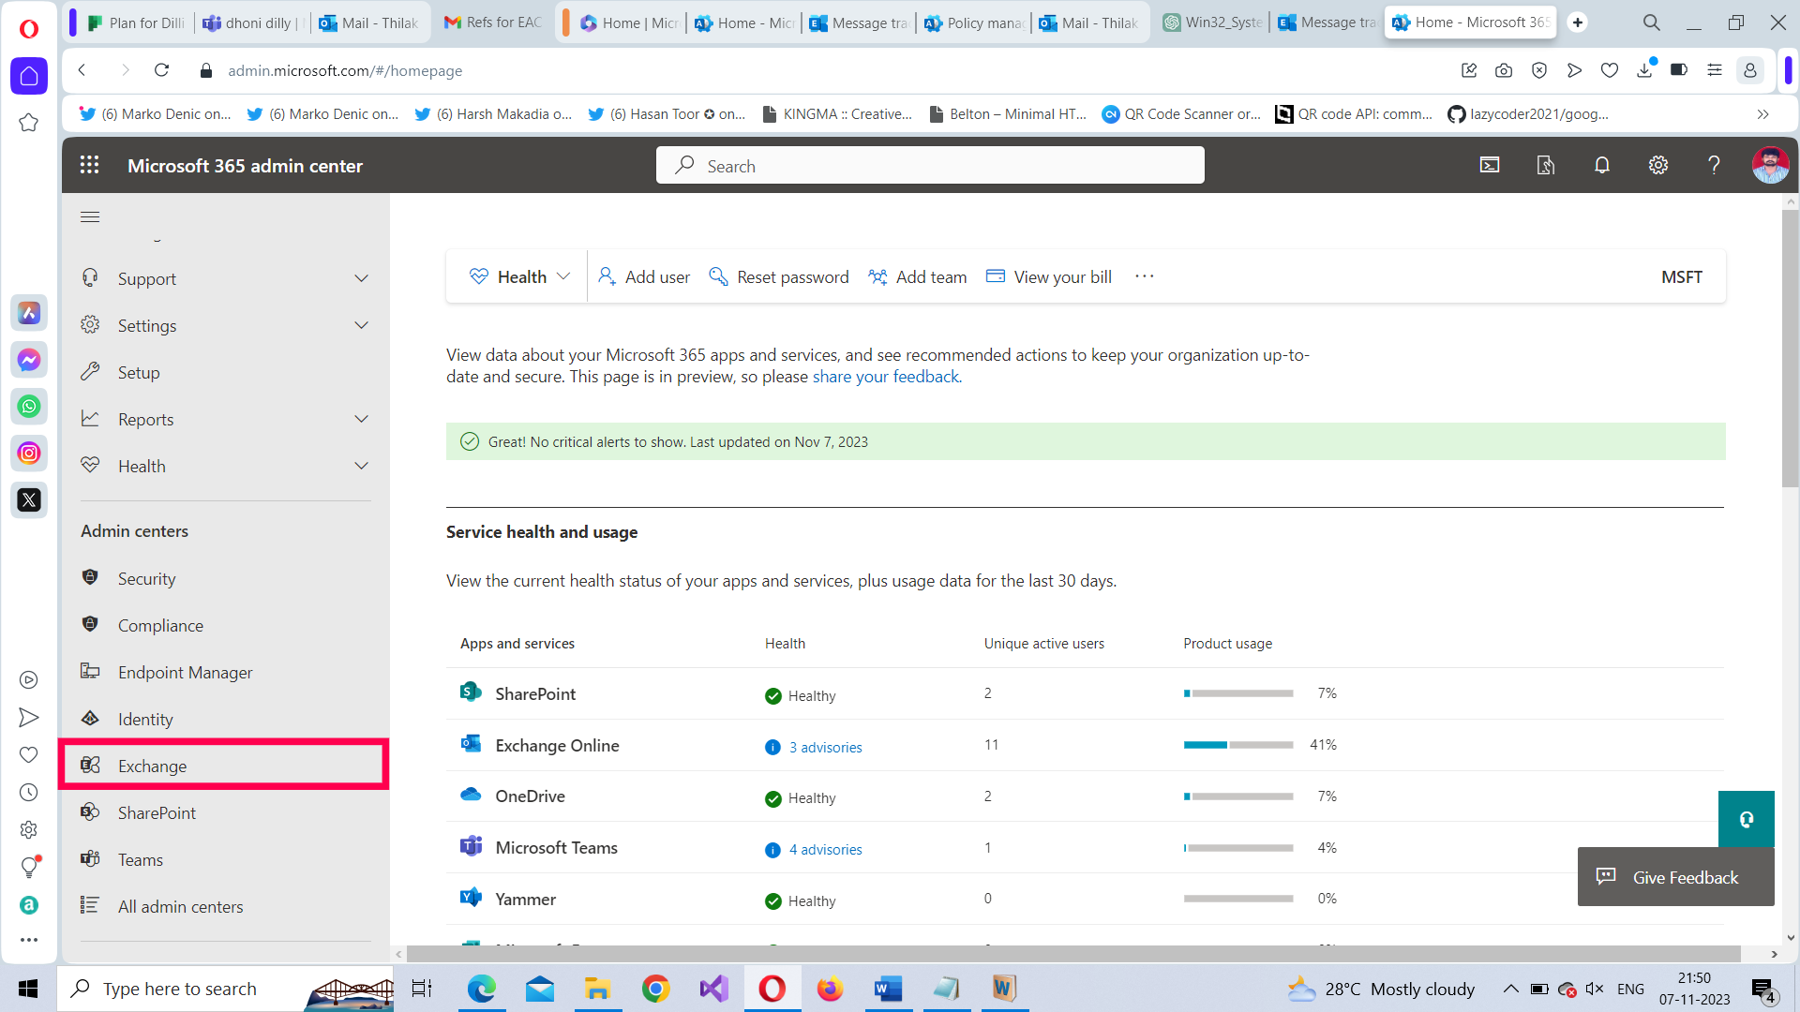
- Click https://admin.microsoft.com/#/homepage and then select Show all > Exchange, as shown in Figure 1 and Figure 2, respectively.
- Once you are in the EAC, select the Mail flow dropdown > Message trace, as shown in Figure 3.
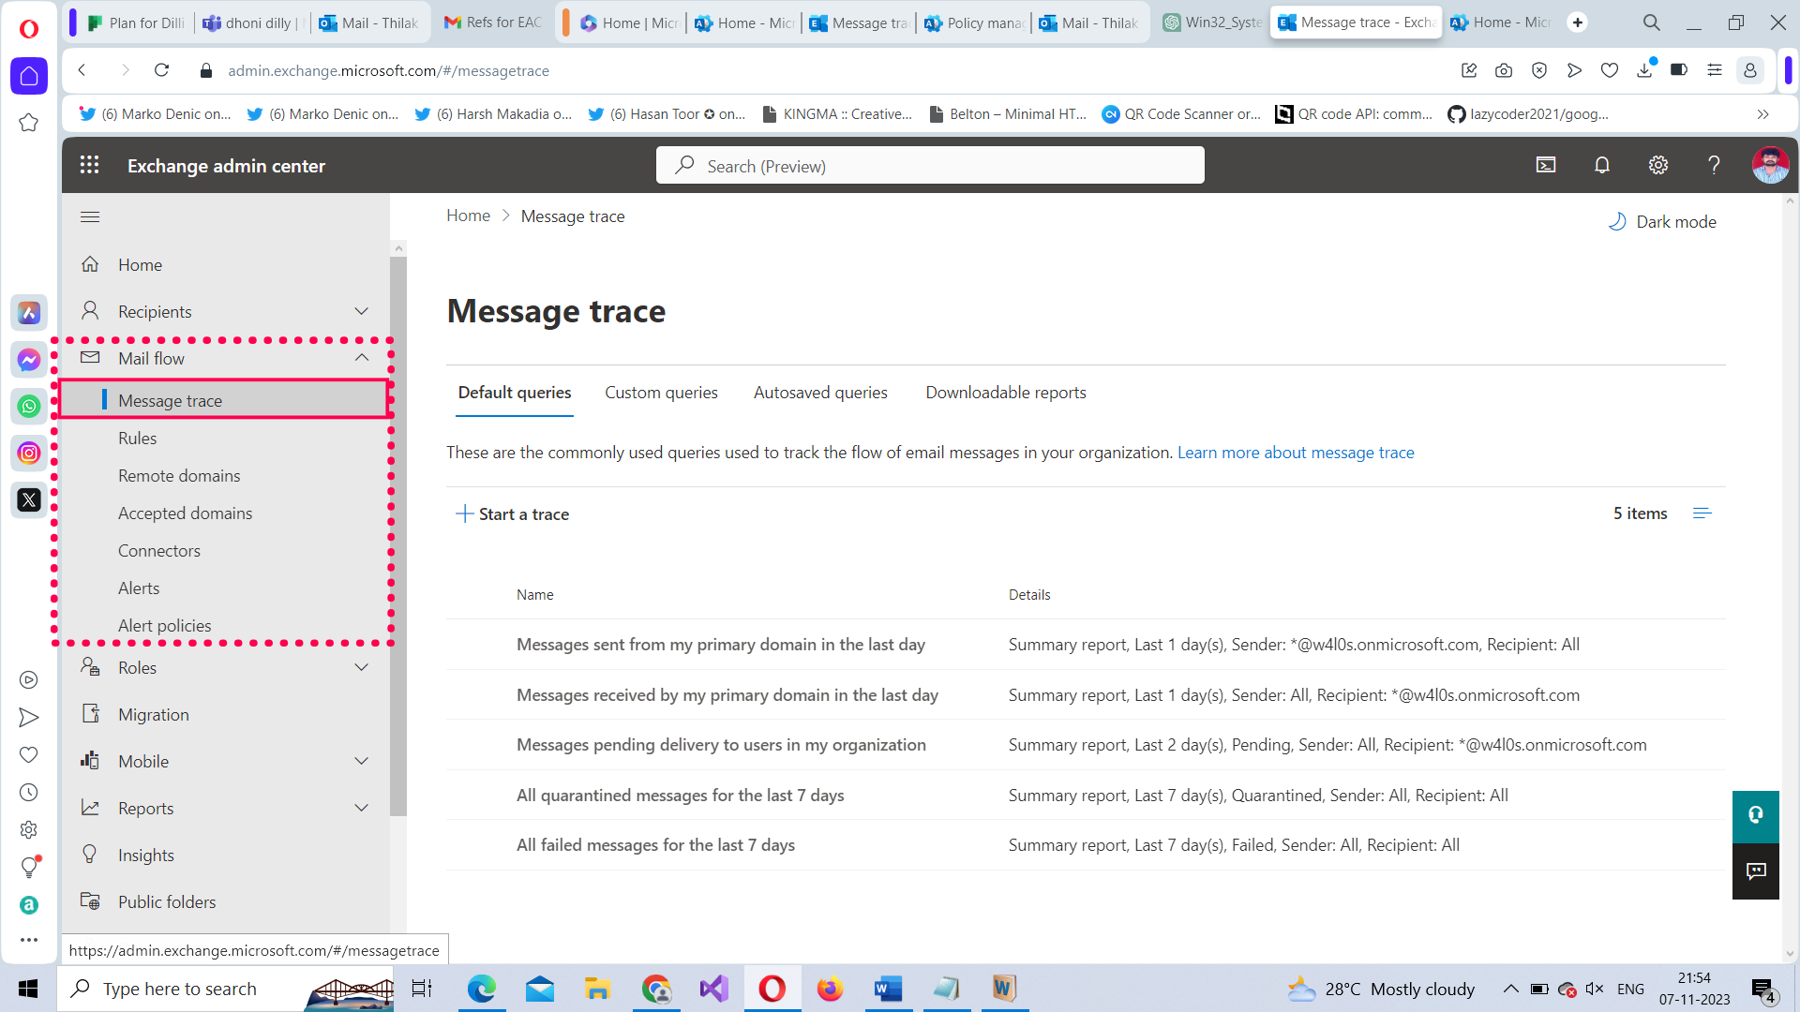
Message Trace Overview
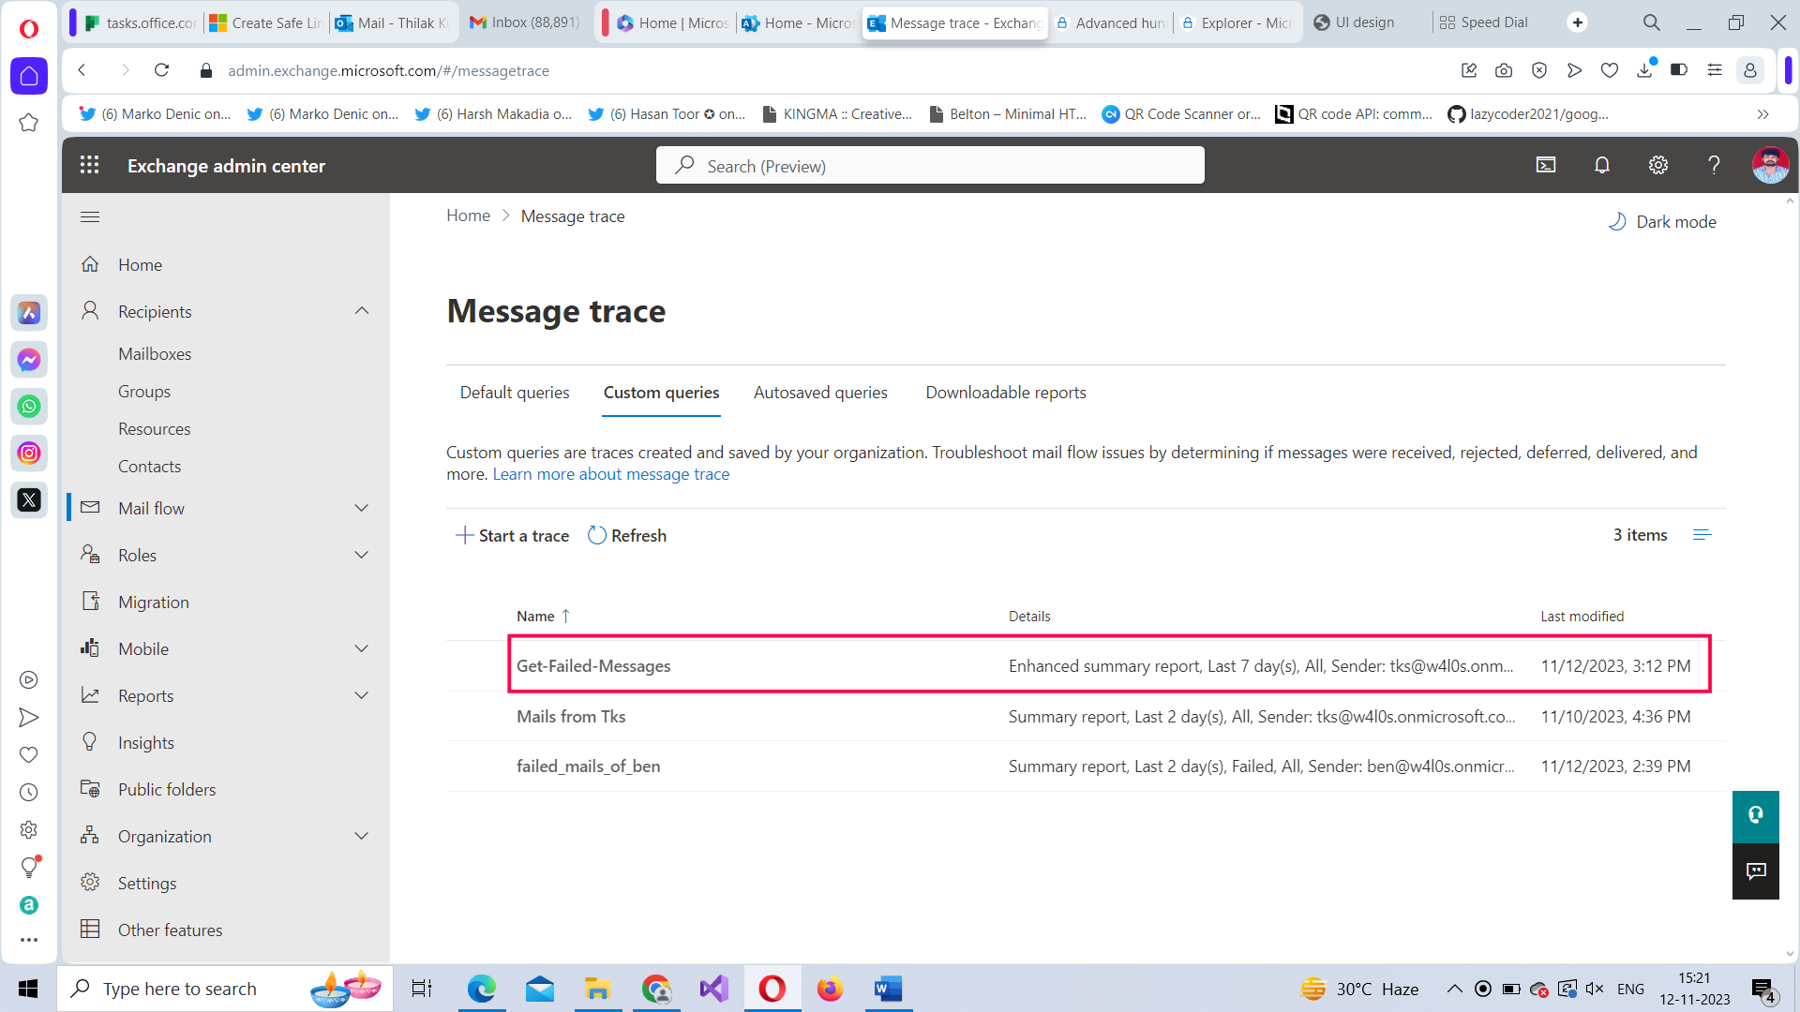
This screen has four tabs, as shown in Figure 4:
- Default queries is the active tab, which lists a set of default queries you can run right out of the box.
- Custom queries is a place to store queries that you have defined when you select Start a trace.
- Autosaved queries lists (or autosaves) the last 10 queries that were run but not saved manually.
- Downloadable reports contains the reports generated by message traces that return large amounts of data.
Running a Predefined Message Trace
Run the default query that reads “Messages sent from my primary domain in the last day” to help you understand the message trace better. This query is supposed to return all the messages that were sent from your domain in the past 24 hours.
Note: Though message traces are designed to track down messages that failed to reach their destination, they can track down the status of any message, including the ones that were delivered successfully.
To run the “Messages sent from my primary domain in the last day” default query, do the following:
Select the query name. The New message trace pane opens to your right, as shown in Figure 5.
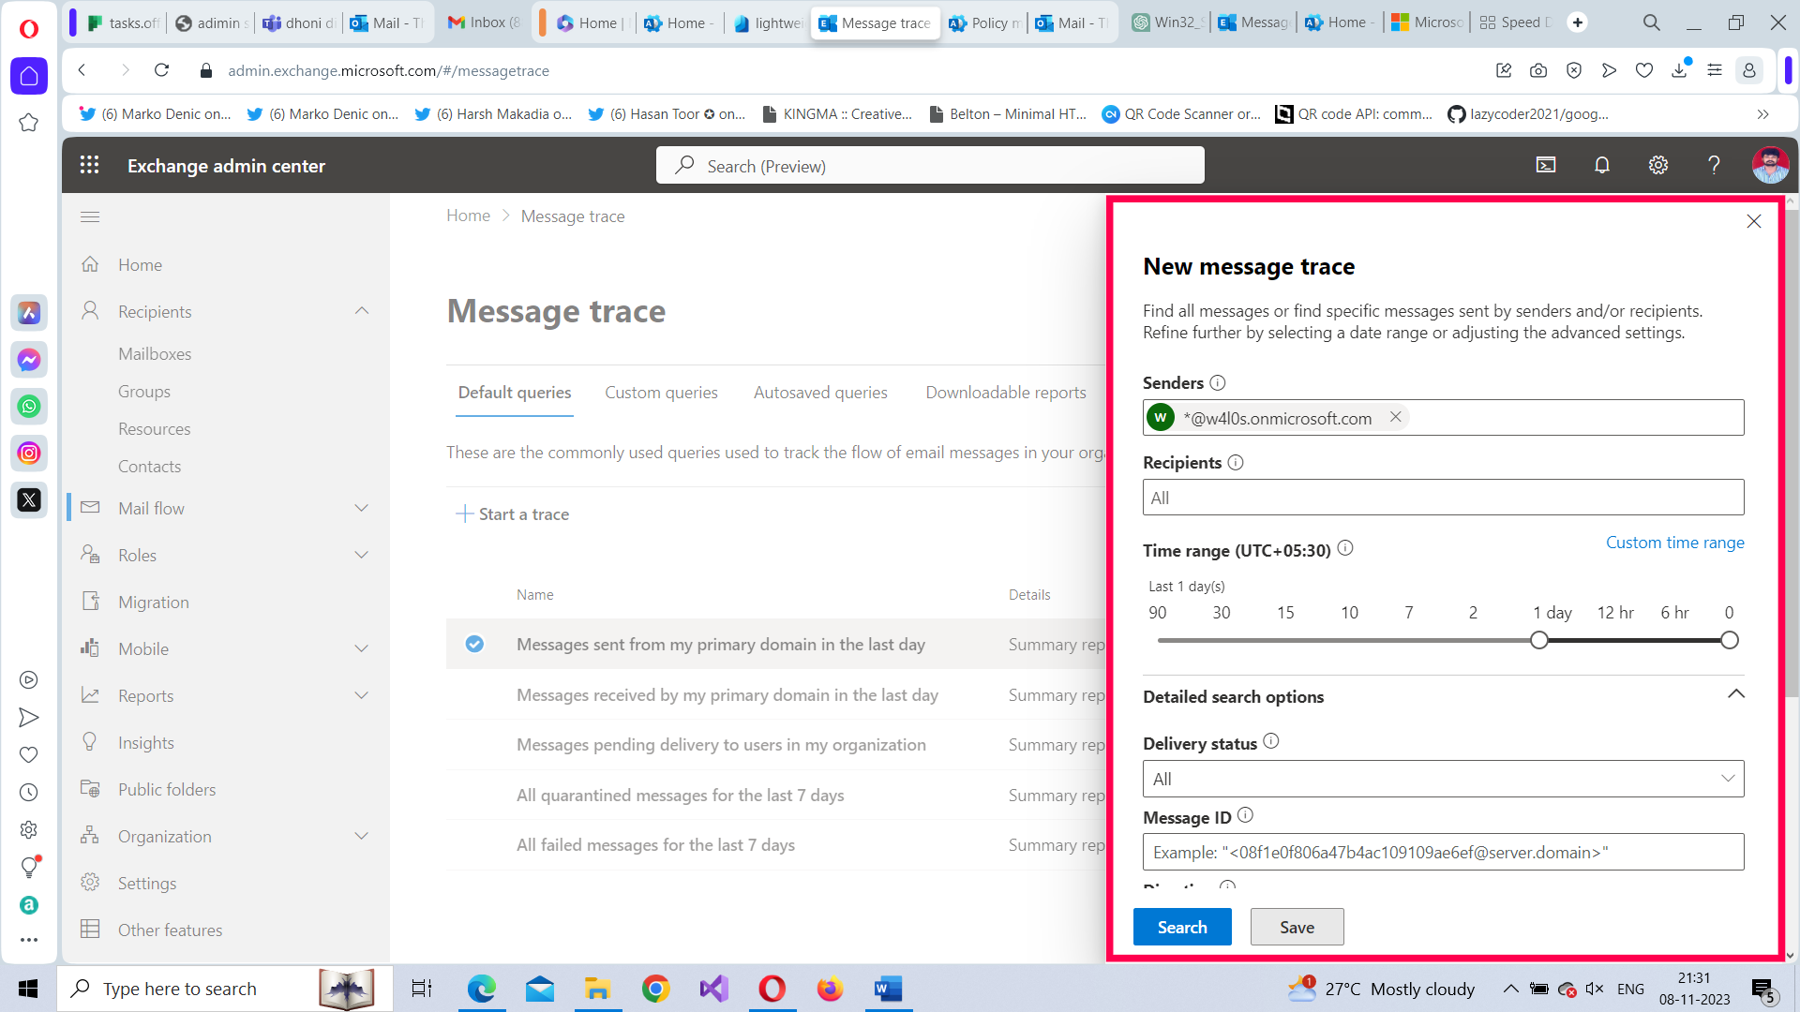
You’ll notice the conditions for running the message trace have been preconfigured for you. To run the message trace, select Search. If any emails were sent out of your domain in the past 24 hours, search results will be displayed, as shown in Figure 6.
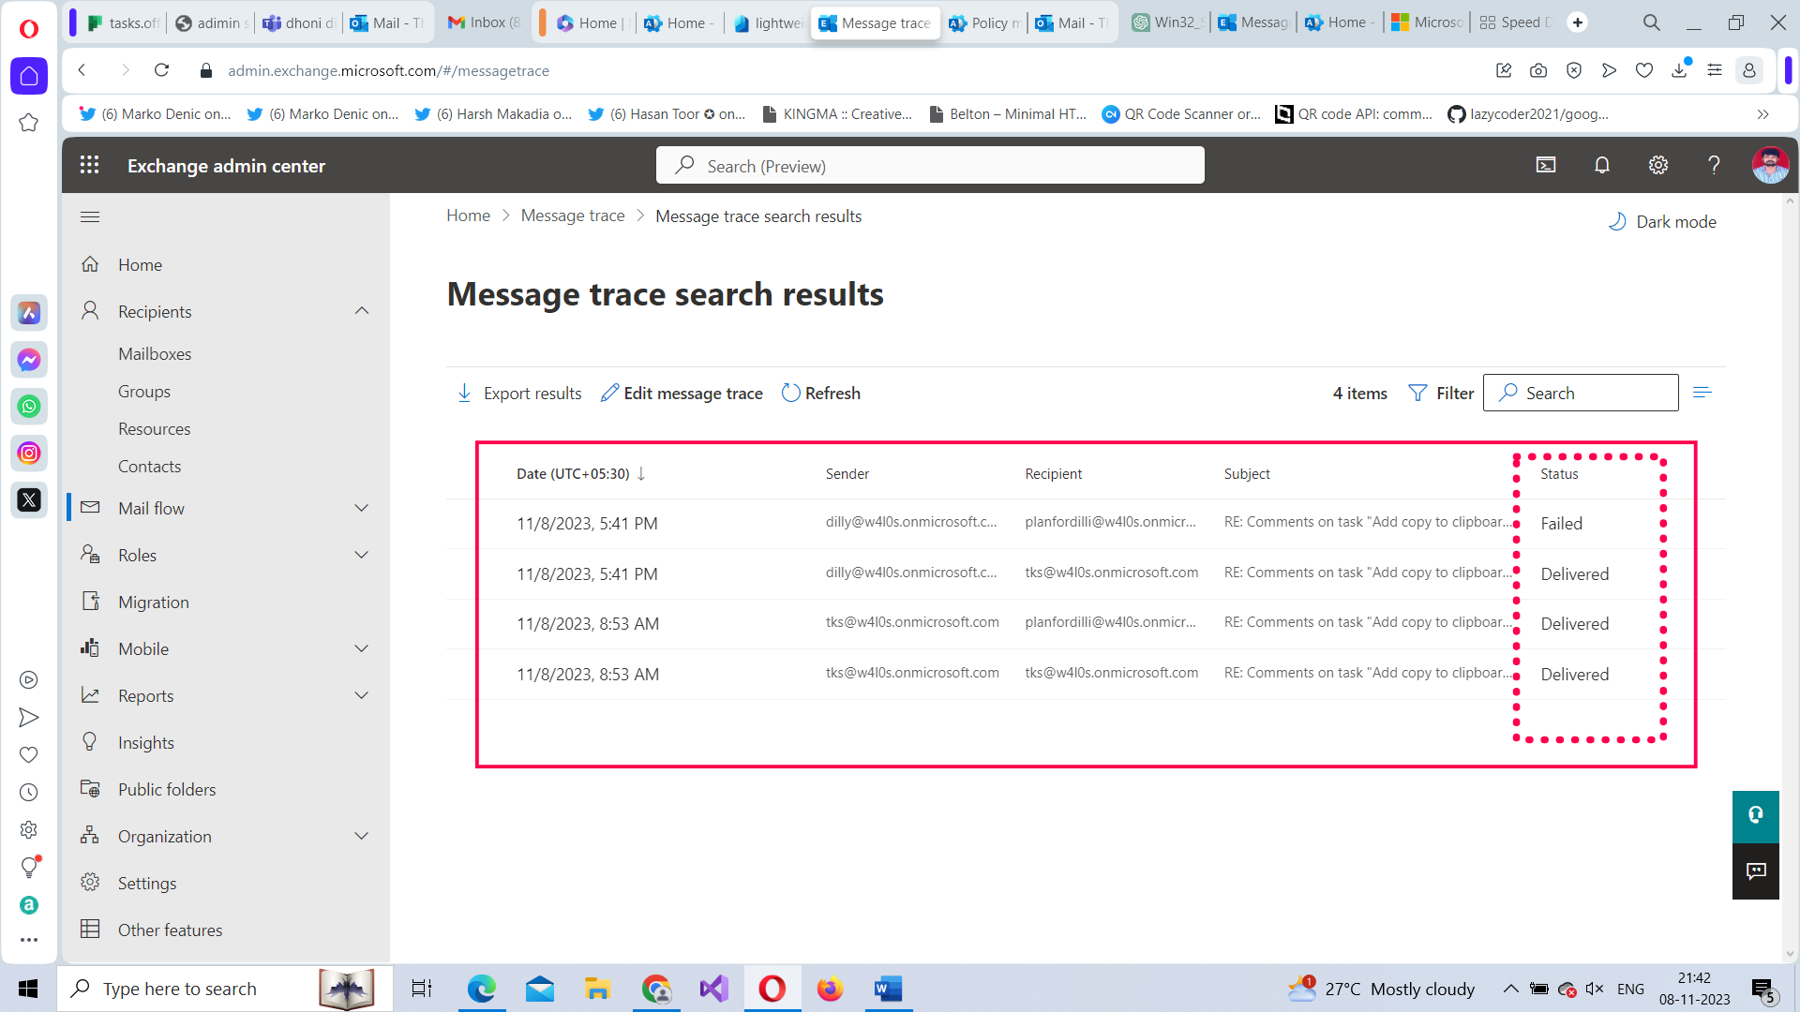
Note: Notice that all the messages—irrespective of their status—are listed.
You just ran a message trace that fetched all the emails sent from your domain in the past 24 hours.
Elements of the New Message Trace Pane
The following information is available in the New message trace pane, which helps you set up a message trace to suit your requirements:
- Senders: Specify the senders of the mail being traced. You can add multiple senders by separating them using a comma. Wildcards are also allowed (example: *@example.com).
- Recipients: Specify the recipients of the email being traced. You can add multiple recipients by separating them using a comma. Wildcards are also allowed (example: *@example.com).
- Time range: Specify the time range or duration for which the search is being performed. Remember that if you specify more than 10 days, the results will be available only in a downloadable CSV format on the Downloadable reports tab.
- Delivery status: Specify the delivery status of the email being traced. For example, Delivered, Failed, Pending, Quarantined, etc.
- Message ID: Specify the message ID of the email being traced. You can look up the message headers to find the message ID of the email being traced.
- Direction: Specify whether you are looking for Inbound or Outbound emails.
- Original client IP address: Specify the IP address of the sender of the email.
- Report type: Specify the type of report you want. The Summary report is the default option. However, if you choose a time range of more than 10 days, the Enhanced summary report is selected automatically. If you need a detailed report, select the Extended report option.
Running a Message Trace by Configuring It from Scratch
Try creating a simple message trace from scratch to track down all the undelivered emails of a user. To run a message trace from scratch, do the following.
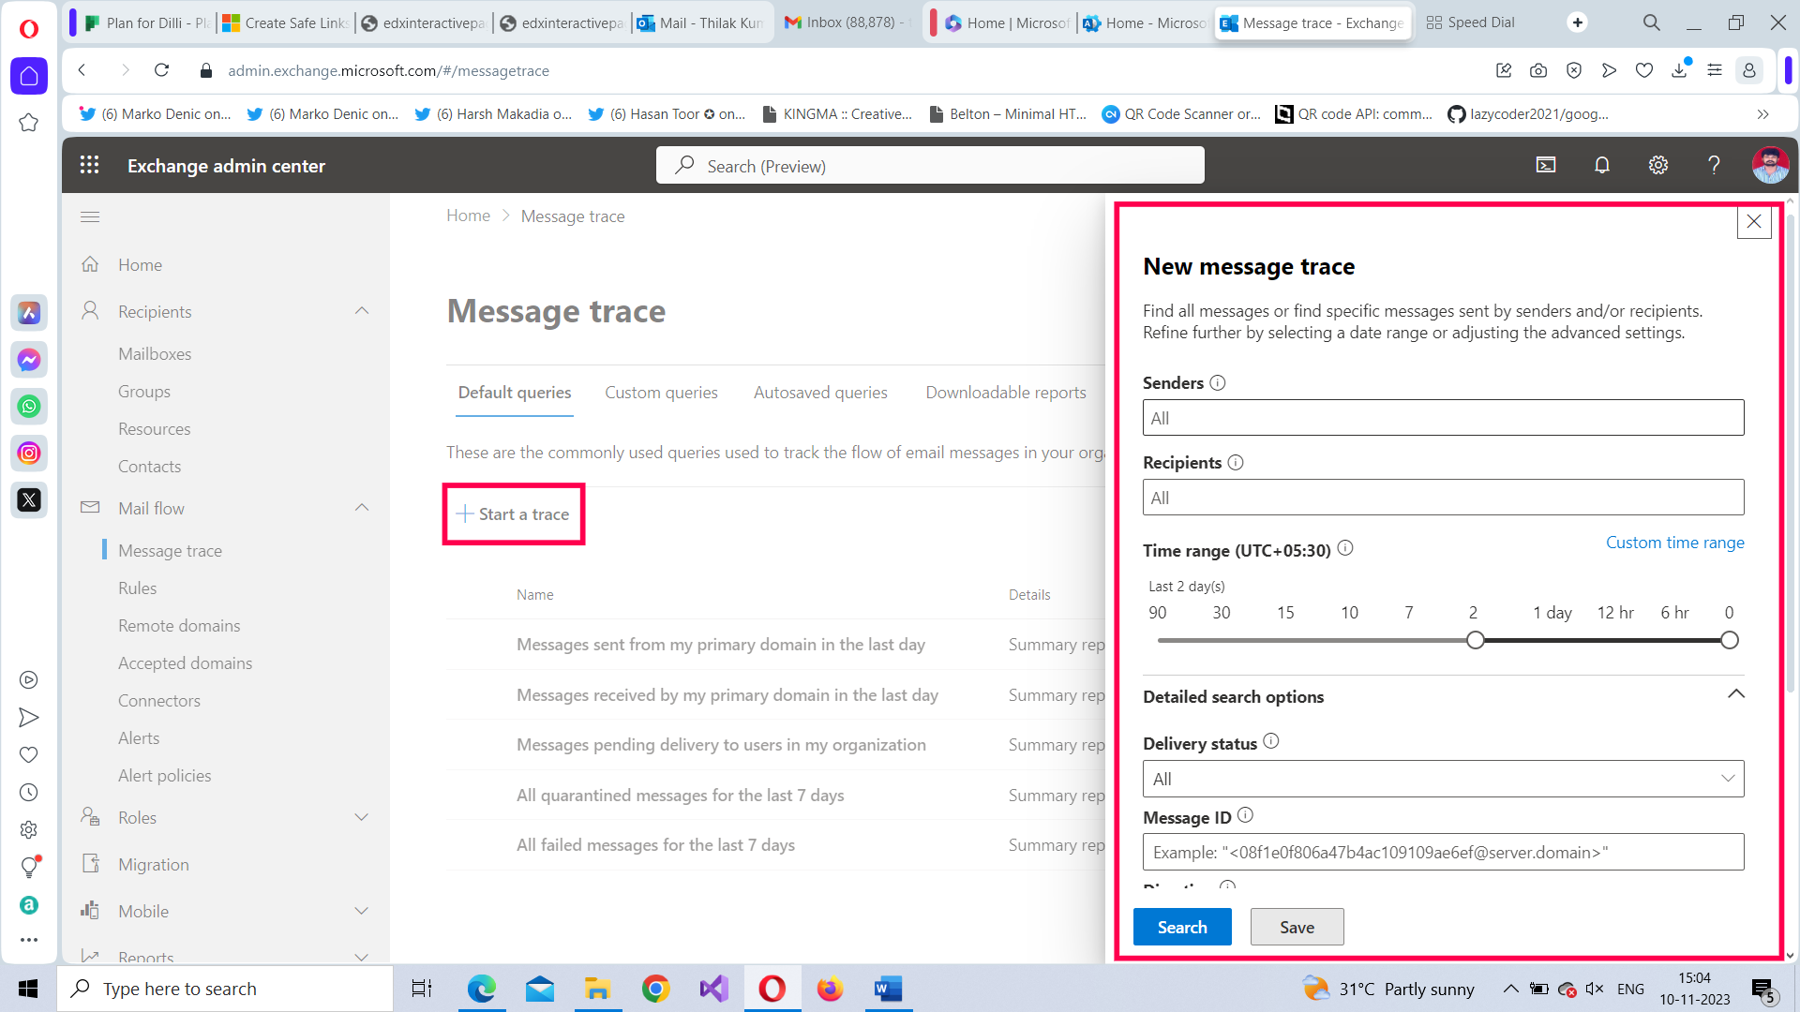
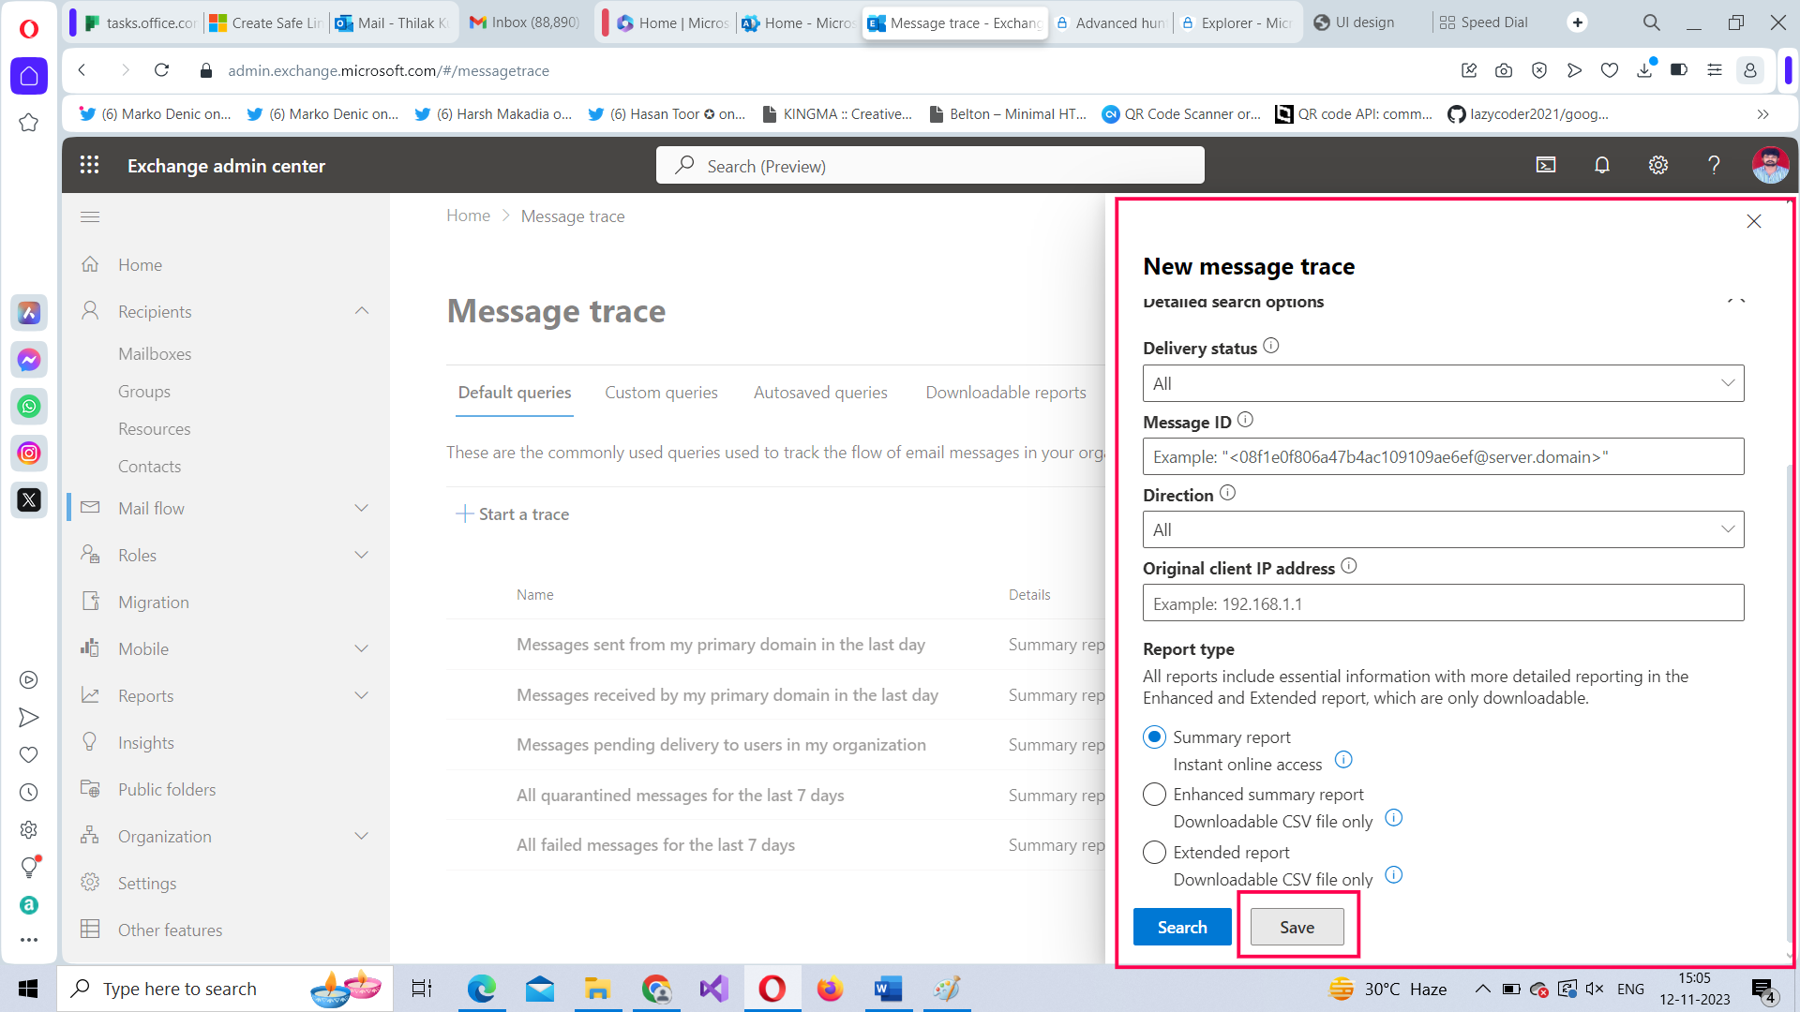
Select Start a trace. This opens the New message trace pane shown in Figure 7.
In the Senders field, enter the email address of the sender, as shown in Figure 8.
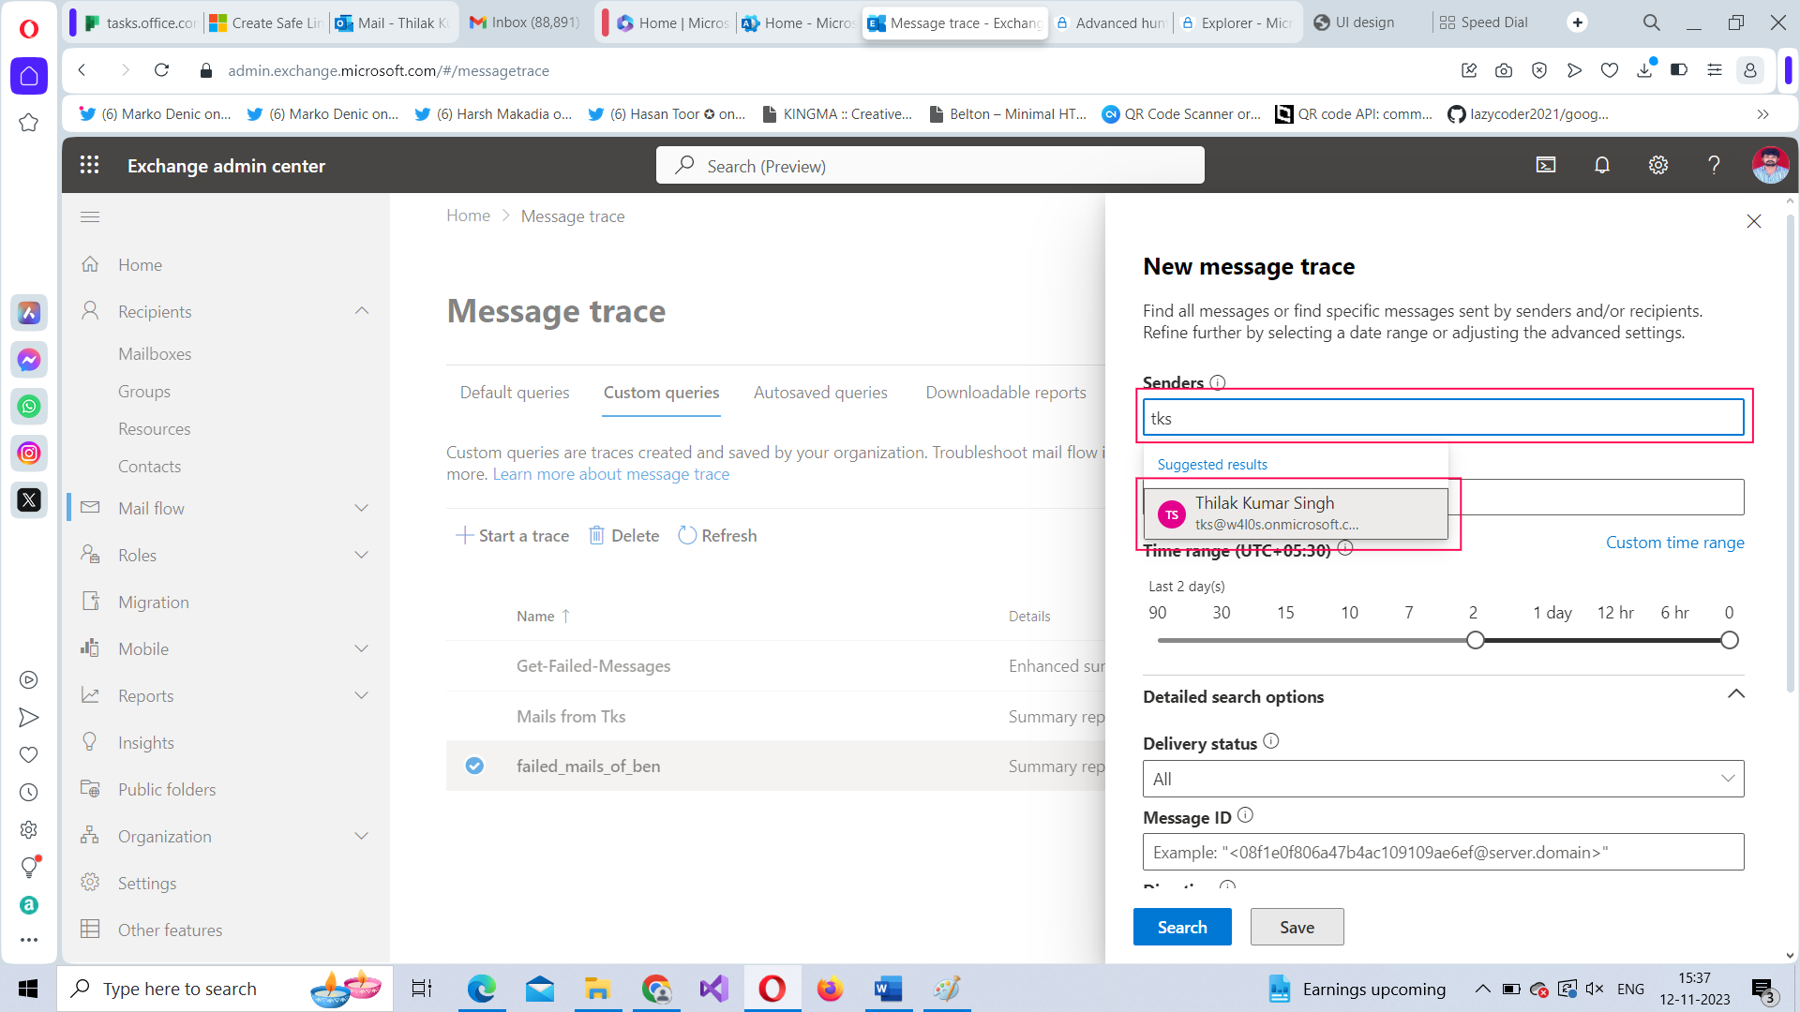
Note: The user email address should pop up as you enter it, as shown in Figure 8.
- Leave the Recipients field value as is because you are going to track down all failed messages.
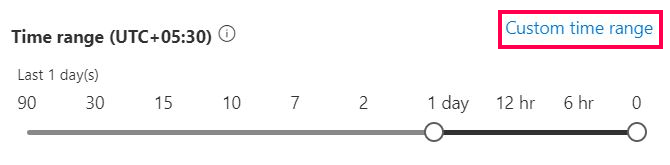
- The Time range is set as 2 days by default. You can slide this to the value you want.
Note: Remember that any value over 10 days produces results only in a downloadable CSV format, available on the Downloadable reports tab.
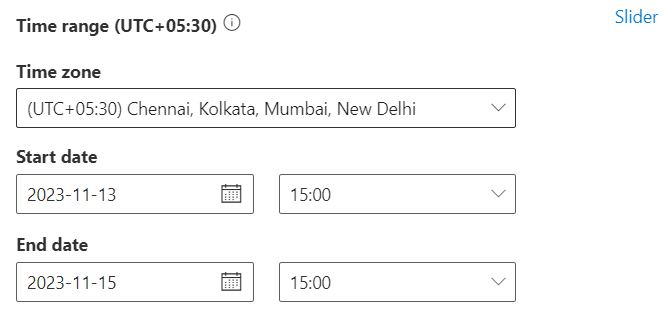
Note: You can also customize the time range and narrow it down to hours by selecting the Custom time range (shown in Figure 9) and specifying the Start date/hours and End date/hours as shown in Figure 10.
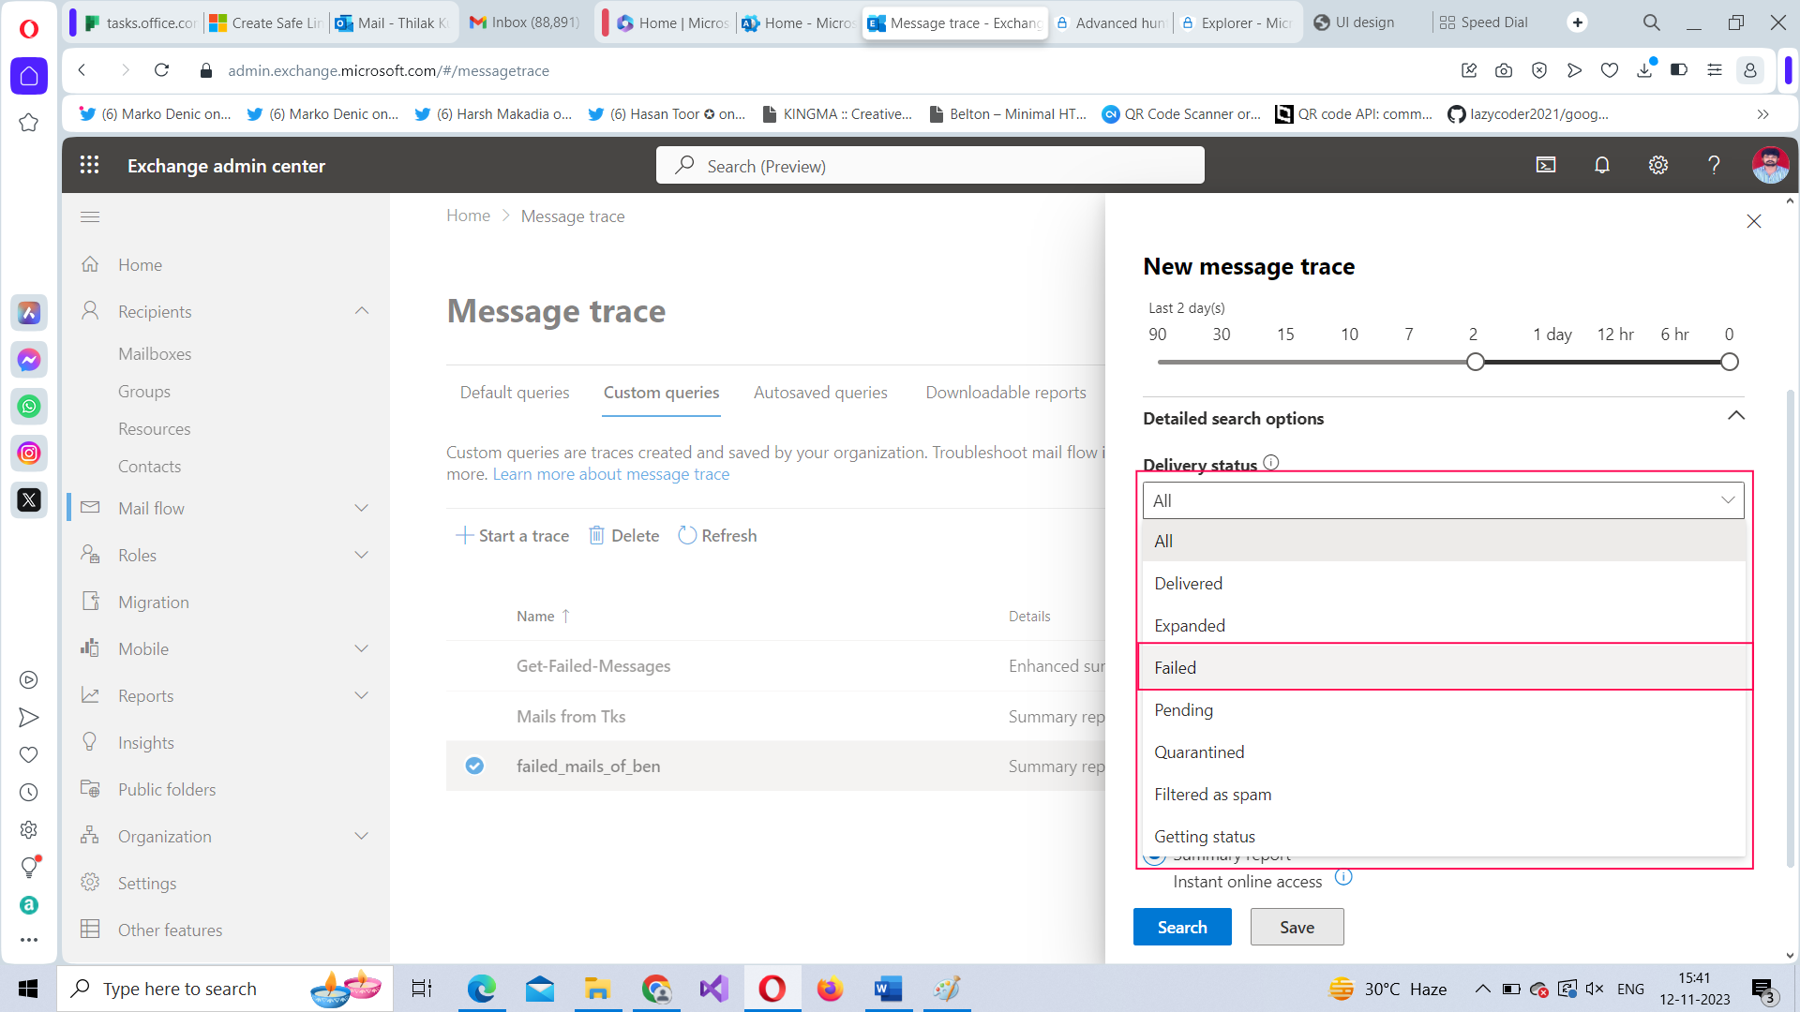
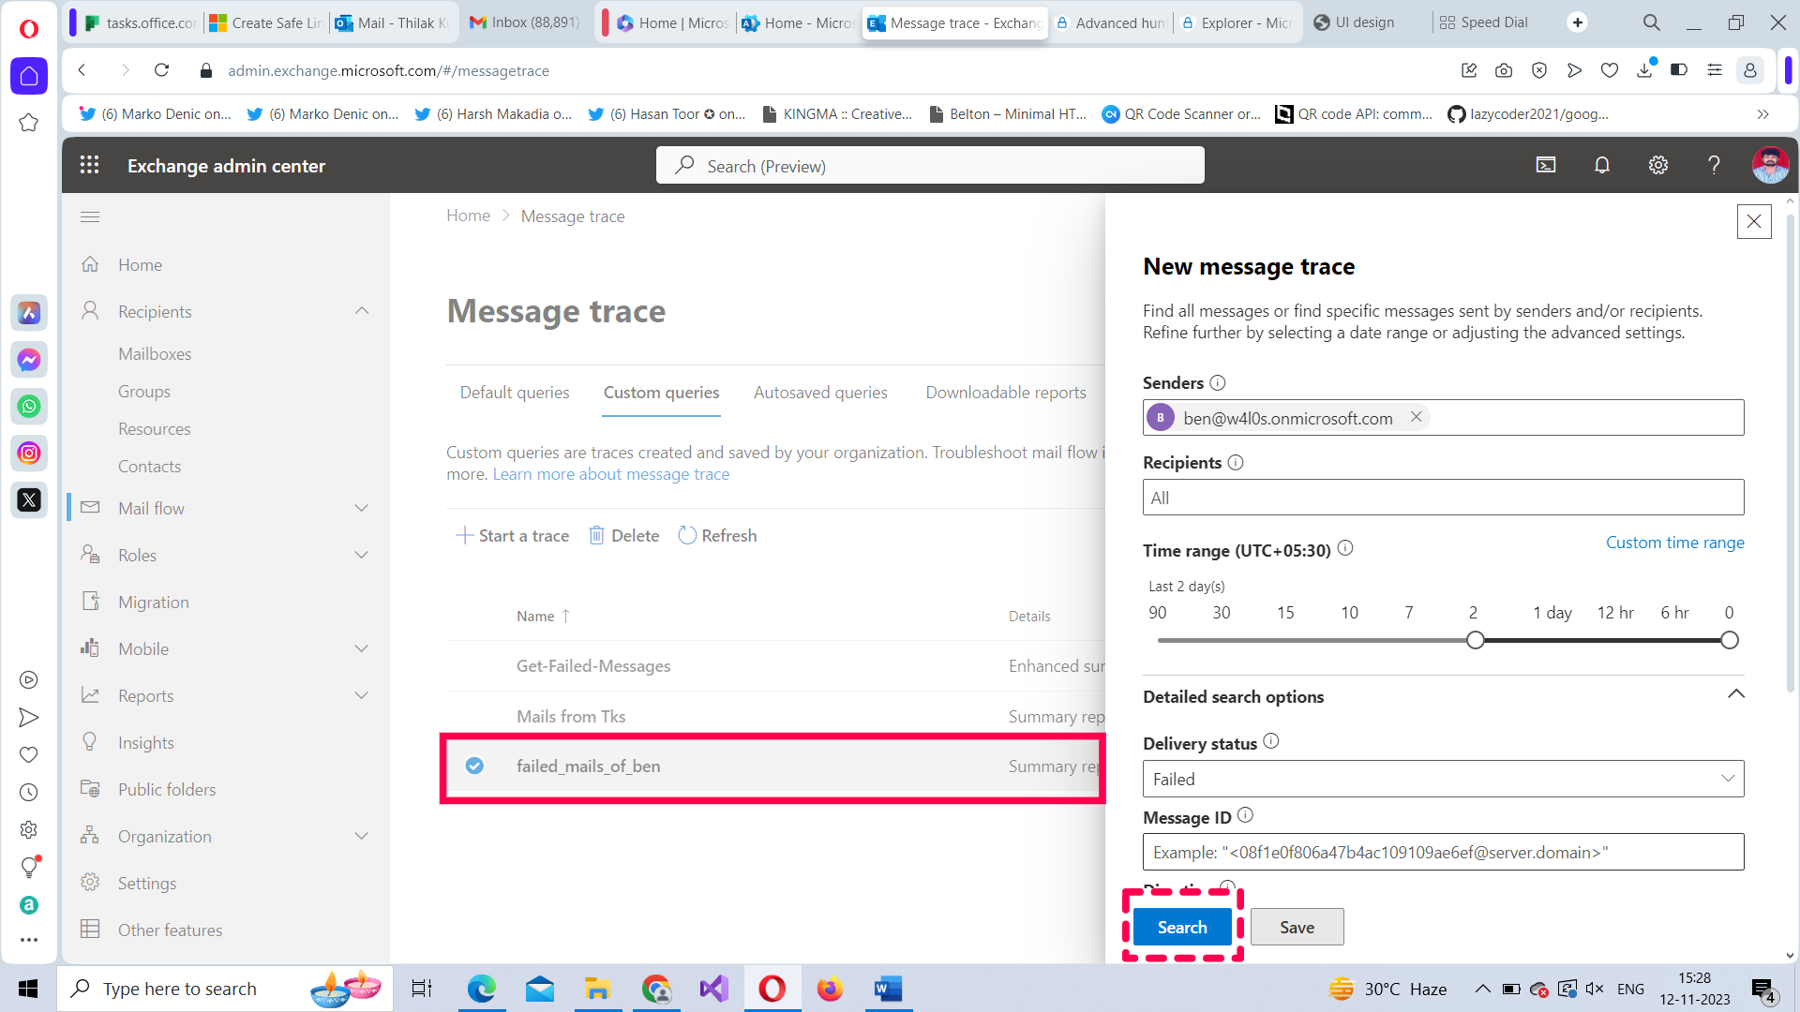
From the Delivery status dropdown, select Failed, as shown in Figure 11.
Leave the Message ID field empty.
Note: If you are searching for a specific email, Message ID comes in handy. To find the Message ID, look at the message headers of the email.
Leave the Direction field value as is.
Note: The All option implies that you are including both Inbound and Outbound emails in the search.
Leave the Original client IP address field empty.
Note: This field allows you to specify the sender’s IP address. It will be useful for investigation purposes, if the user’s machine has been compromised and sending out a lot of spam.
Select the Report type you want:
- Summary report: Results are presented on the screen.
- Enhanced summary report: Results are available in the form of a downloadable CSV file on the Downloadable reports tab.
- Extended report: Results are in the form of a downloadable CSV file on the Downloadable reports tab.
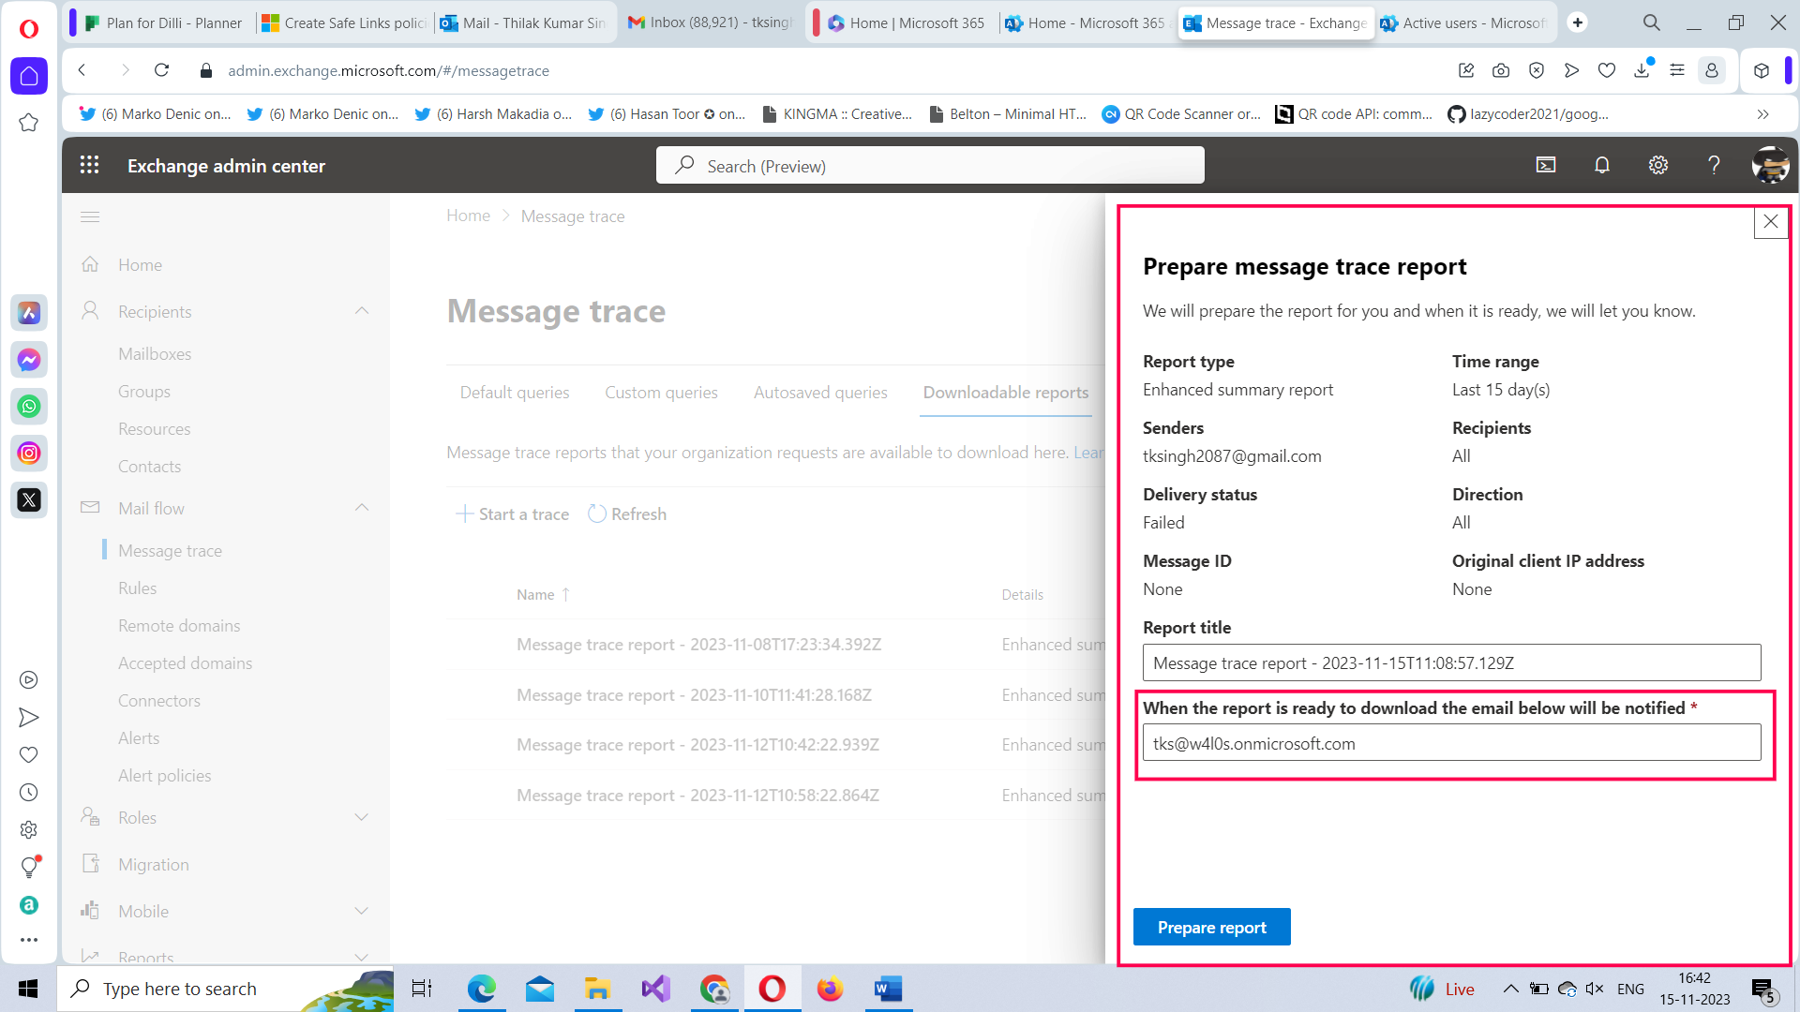
Note: If you choose a time range of over 10 days, not only will the Enhanced summary report get selected automatically, you will have an additional step to perform. When you select Next, a Prepare message trace report pane opens, as shown in Figure 12. Here you can enter an email ID to which the report gets forwarded. This is in addition to the report becoming available on the Downloadable reports tab.
Running the Configured Message Trace Immediately
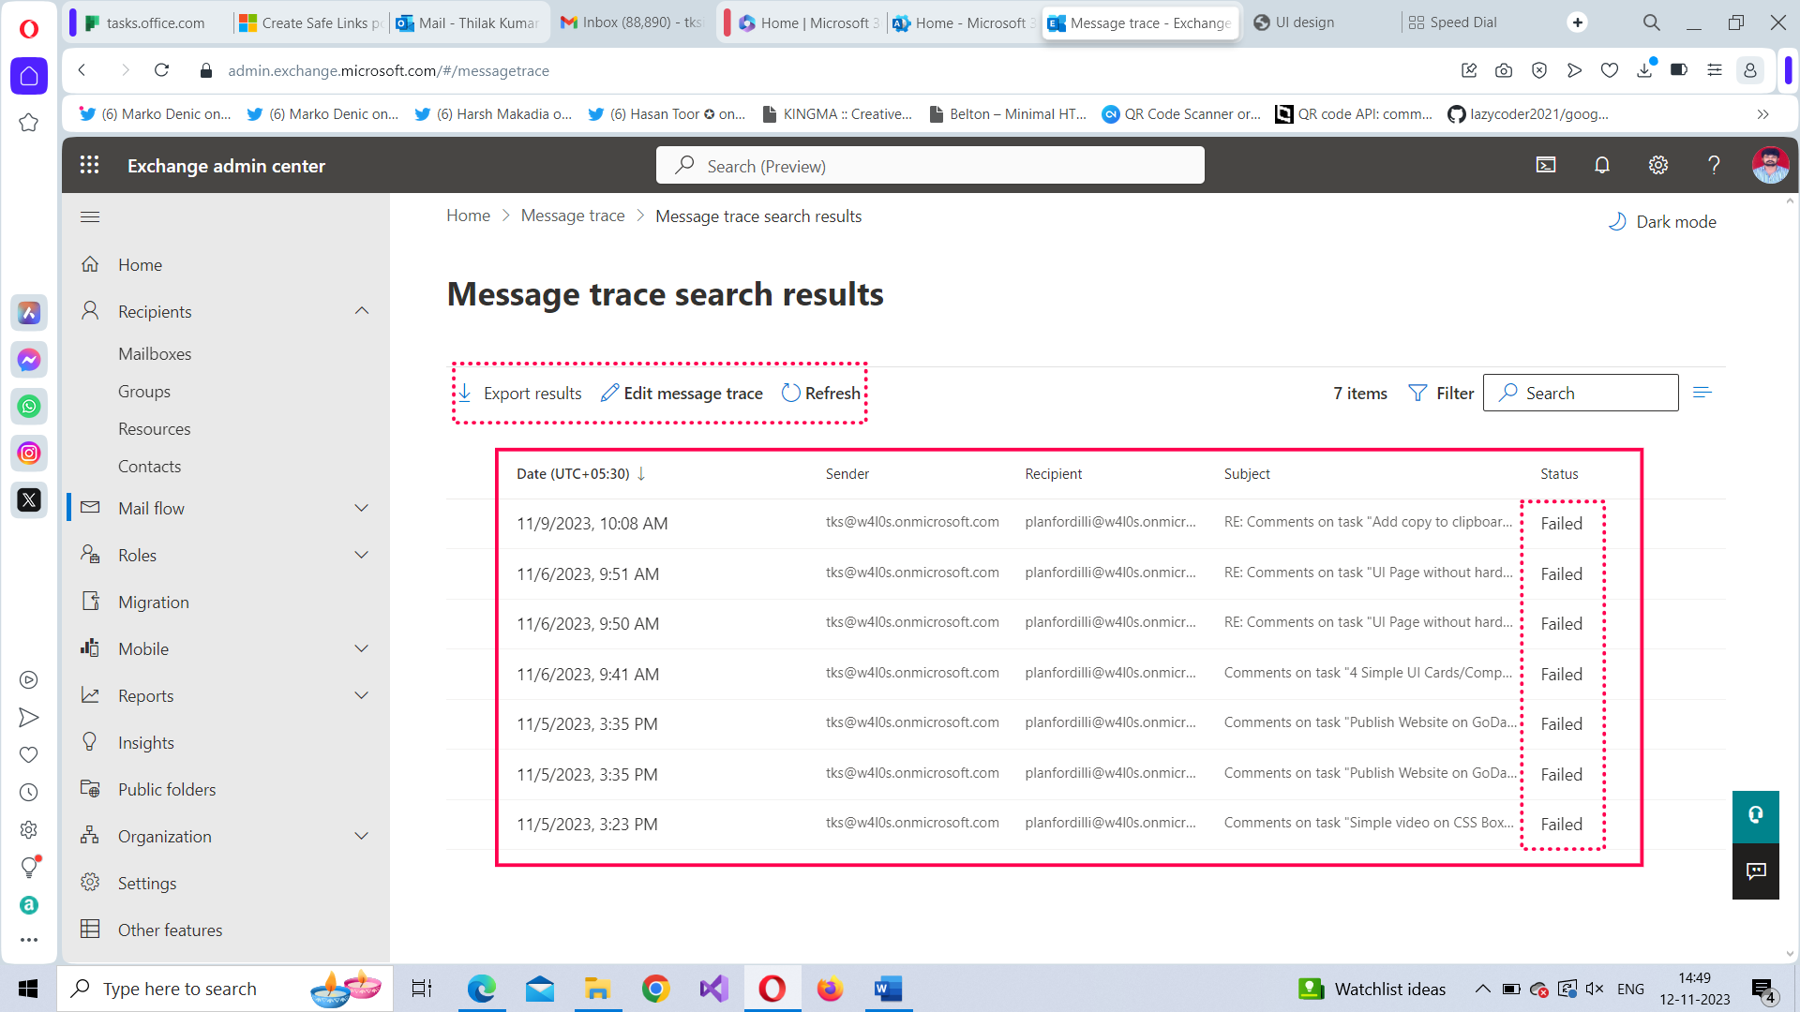
To run the configured message trace immediately, select the Search button. The list of failed messages is displayed as shown in Figure 13.
Saving the Configured Message Trace and Running It Later
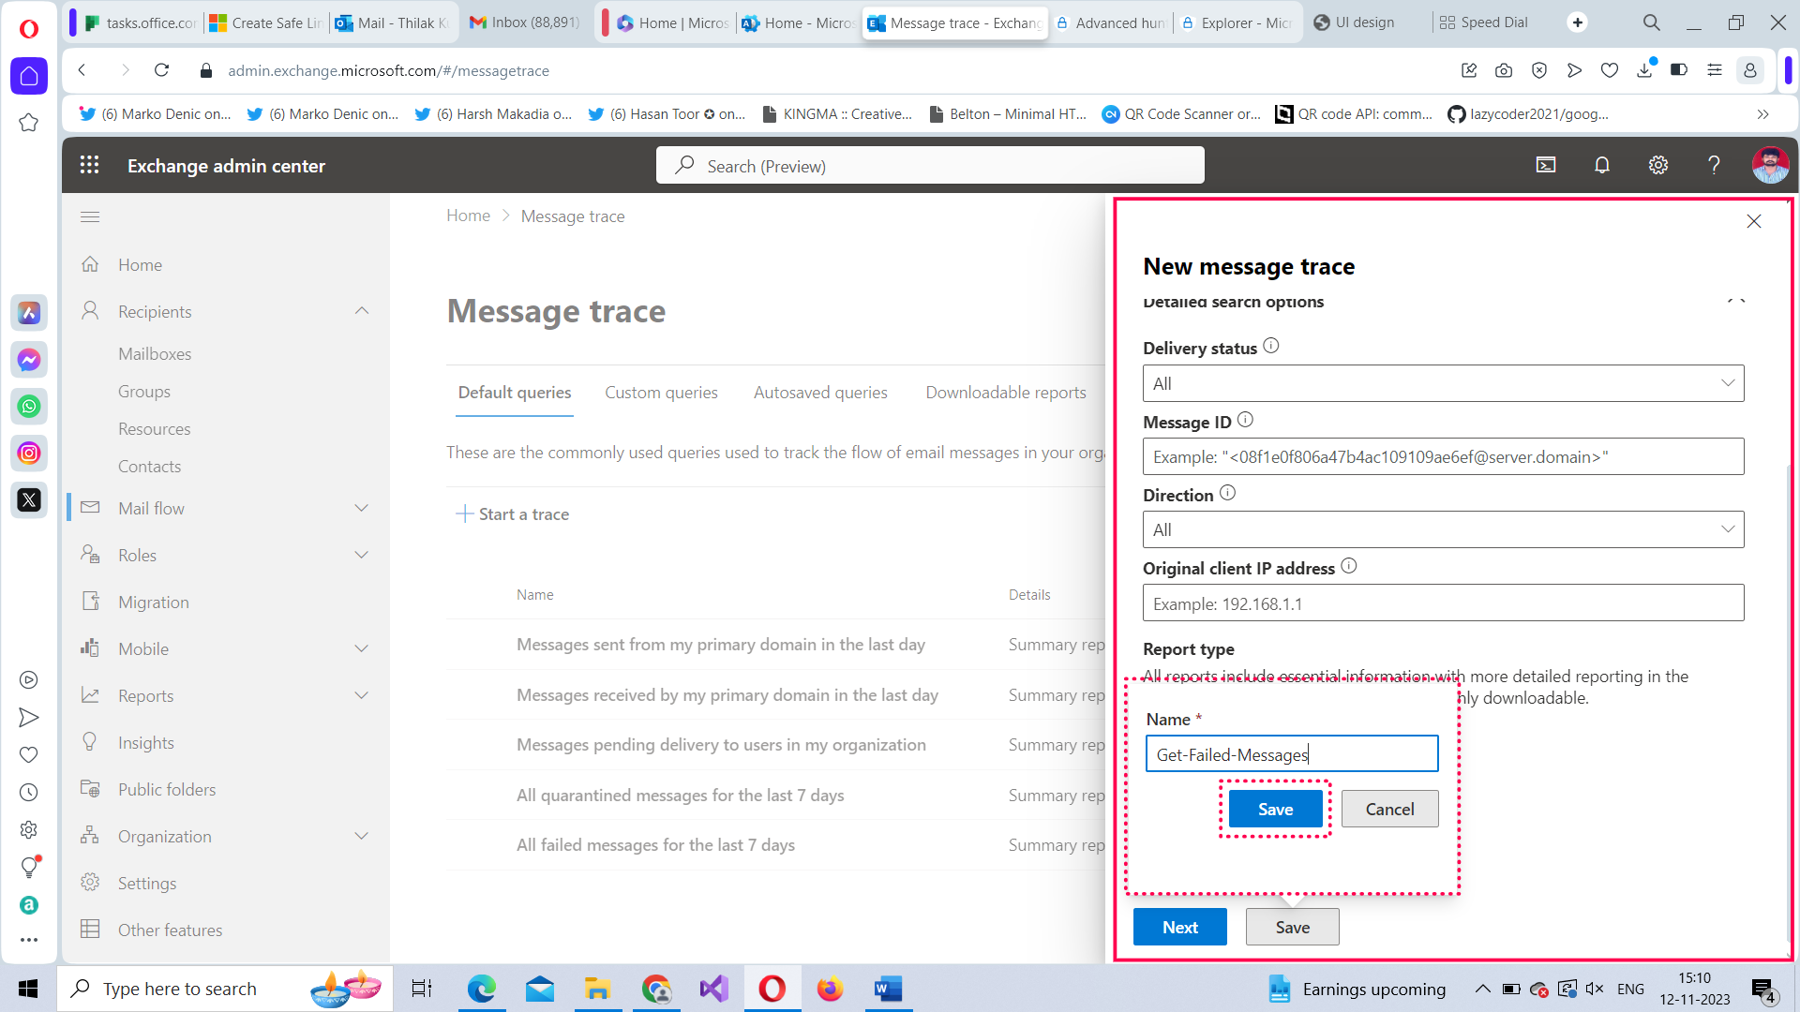
To save the configured message trace and run it whenever you want, select Save instead of Search, as shown in Figure 14.
A pop-up box opens as shown in Figure 15. Enter the name for the message trace that you are configuring in it, and then select Save, as shown in Figure 15.
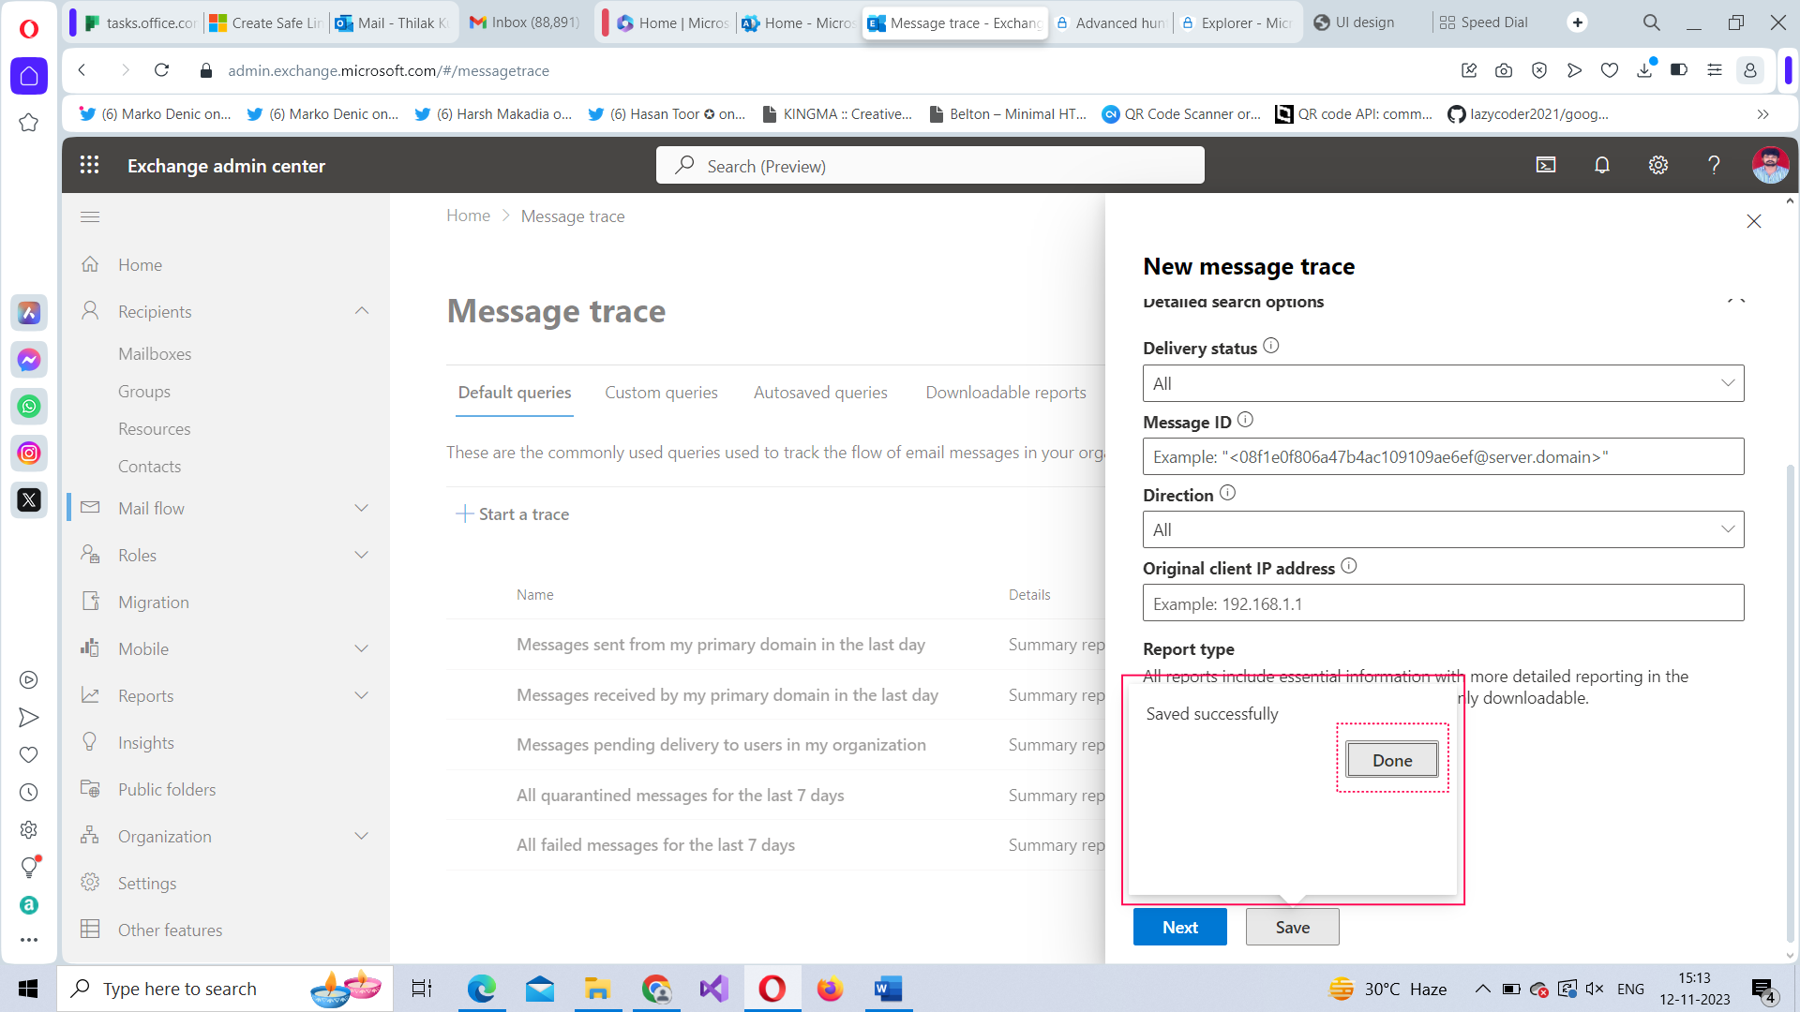
You will get a Saved successfully message, as shown in Figure 16. Select Done and then close the New message trace pane.
Accessing the Saved Message Trace
When you save a message trace, you are configuring a custom query of your own. This becomes available on the Custom queries tab, as shown in Figure 17.
To run a saved message trace, select the message trace. The New message trace pane opens. Select Search as shown in Figure 18, and the results are displayed.
Working with the Message Trace Results
If you select Summary Report, the results will be available in Message trace search results, as shown in Figure 19.
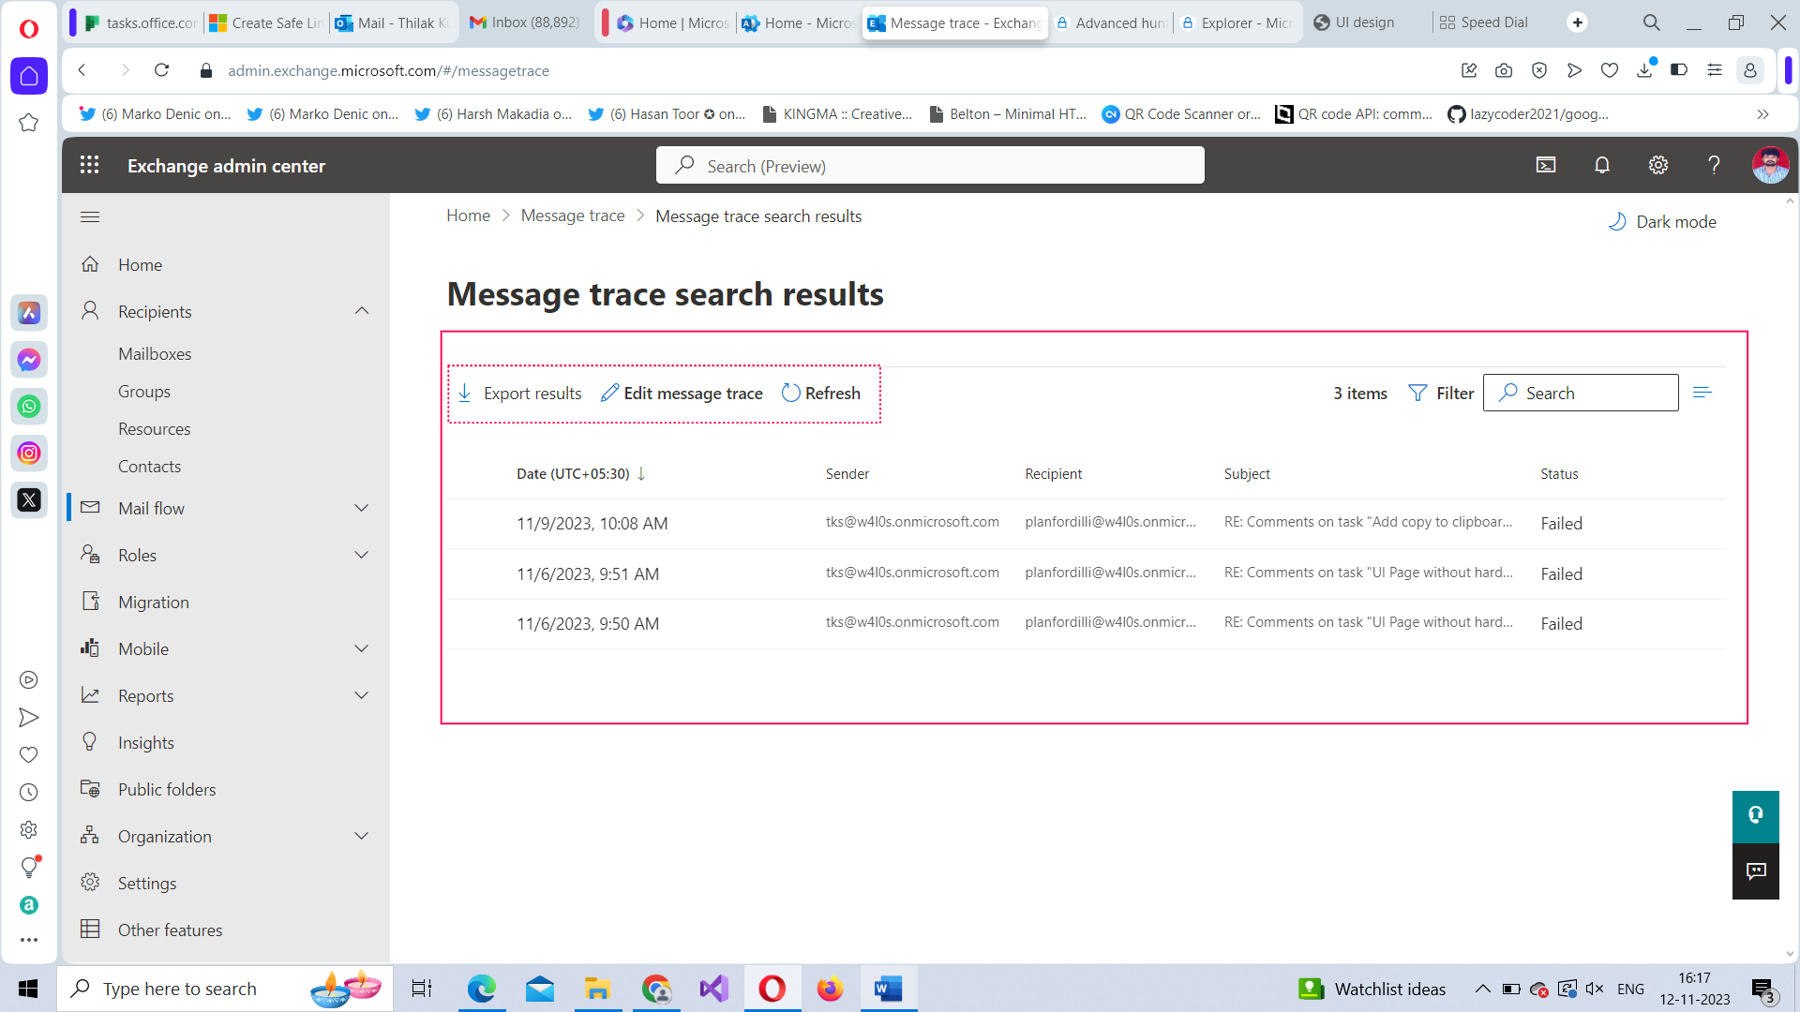
Note:
- Even with summary reports, you can export the fetched results as CSV files.
- Select Refresh, if the results were not fetched.
Investigating Failed Messages
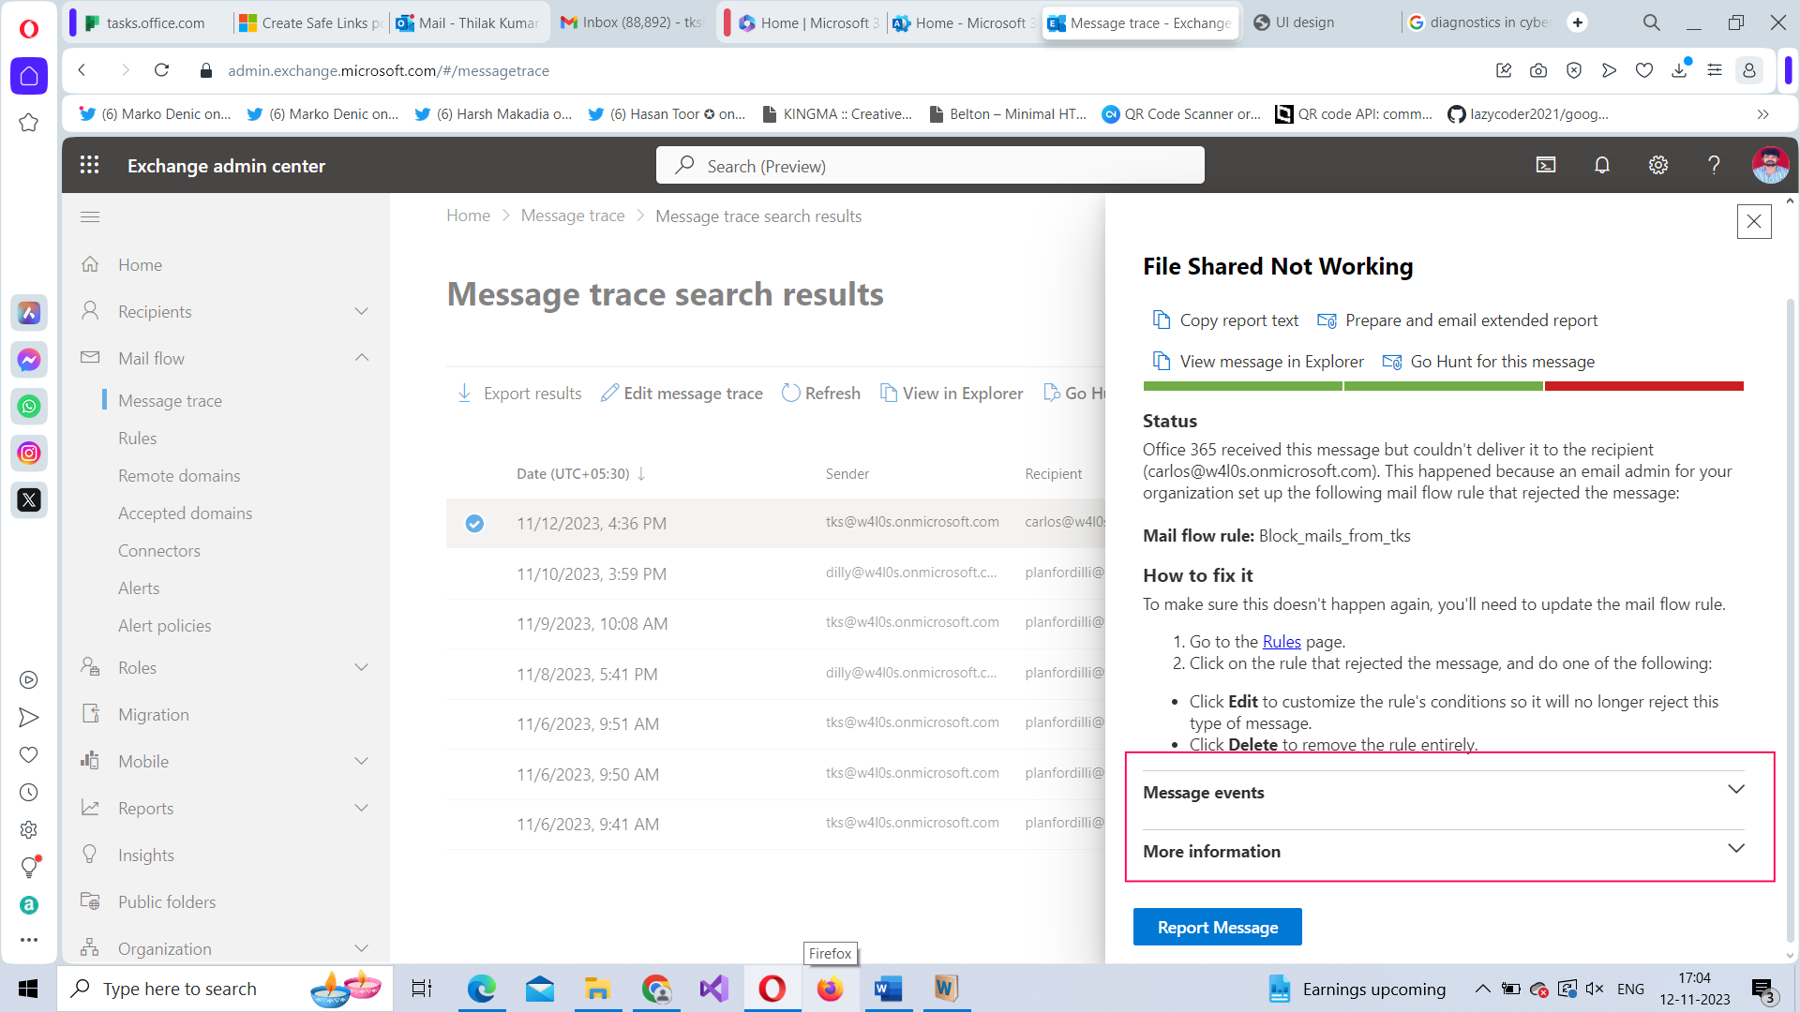
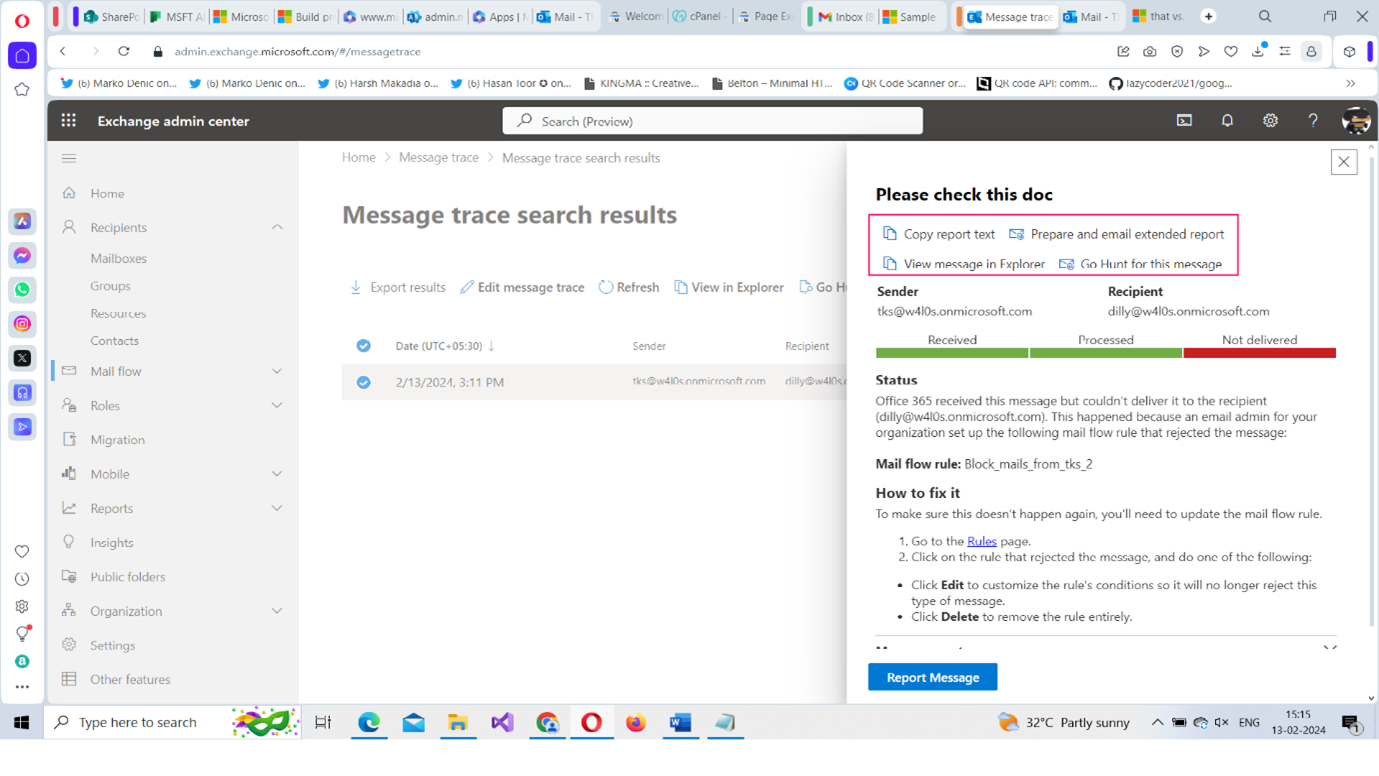
To find out why a message failed, select the failed message. The message diagnostics pane opens, as shown in Figure 20.
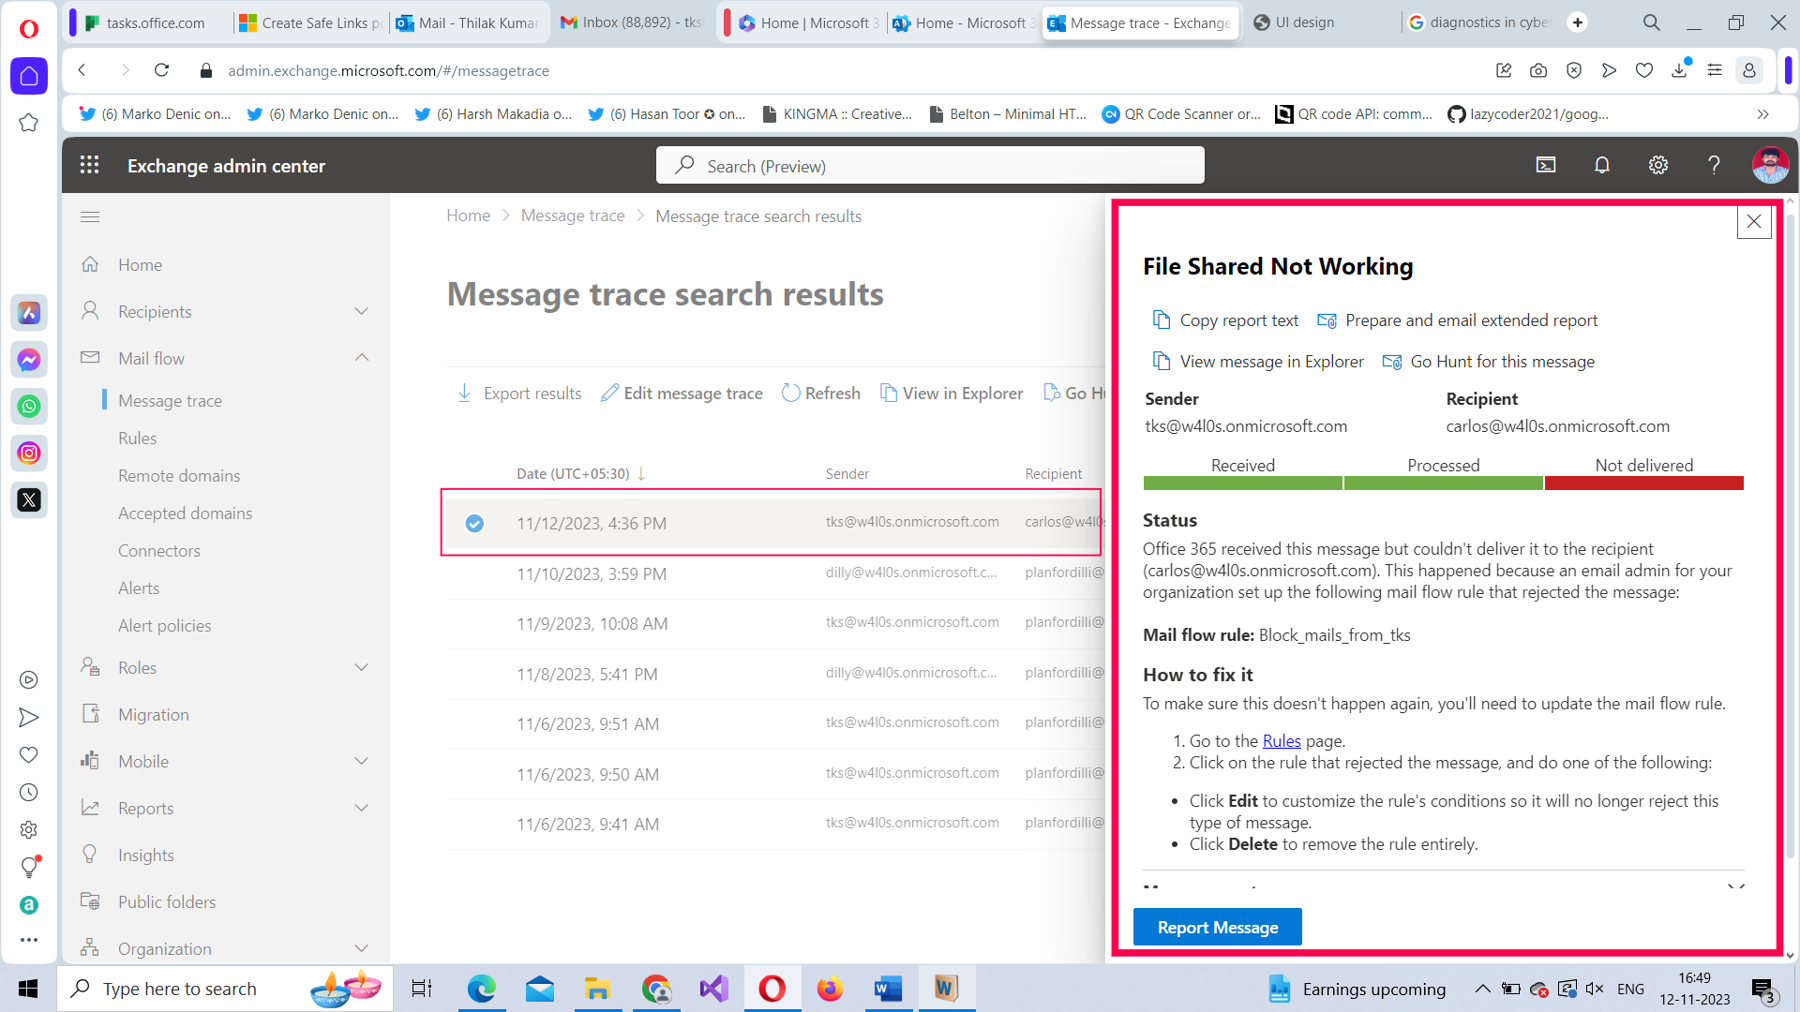
- Since the message was not delivered, the delivery status is marked in red.
- The reason for failure and the steps to fix the issue also appear. In the previous case, shown in Figure 20, it was a mail flow rule that prevented the mail from being delivered. To fix it, to turn off the mail flow rule to let the message go through.
- If you scroll down the message diagnostics pane, you will see two dropdowns, as shown in Figure 21: Message events and More information.
If you select the Message events dropdown, you’ll notice that it registers all the events that transpired before the message was rejected, as shown in Figure 22.
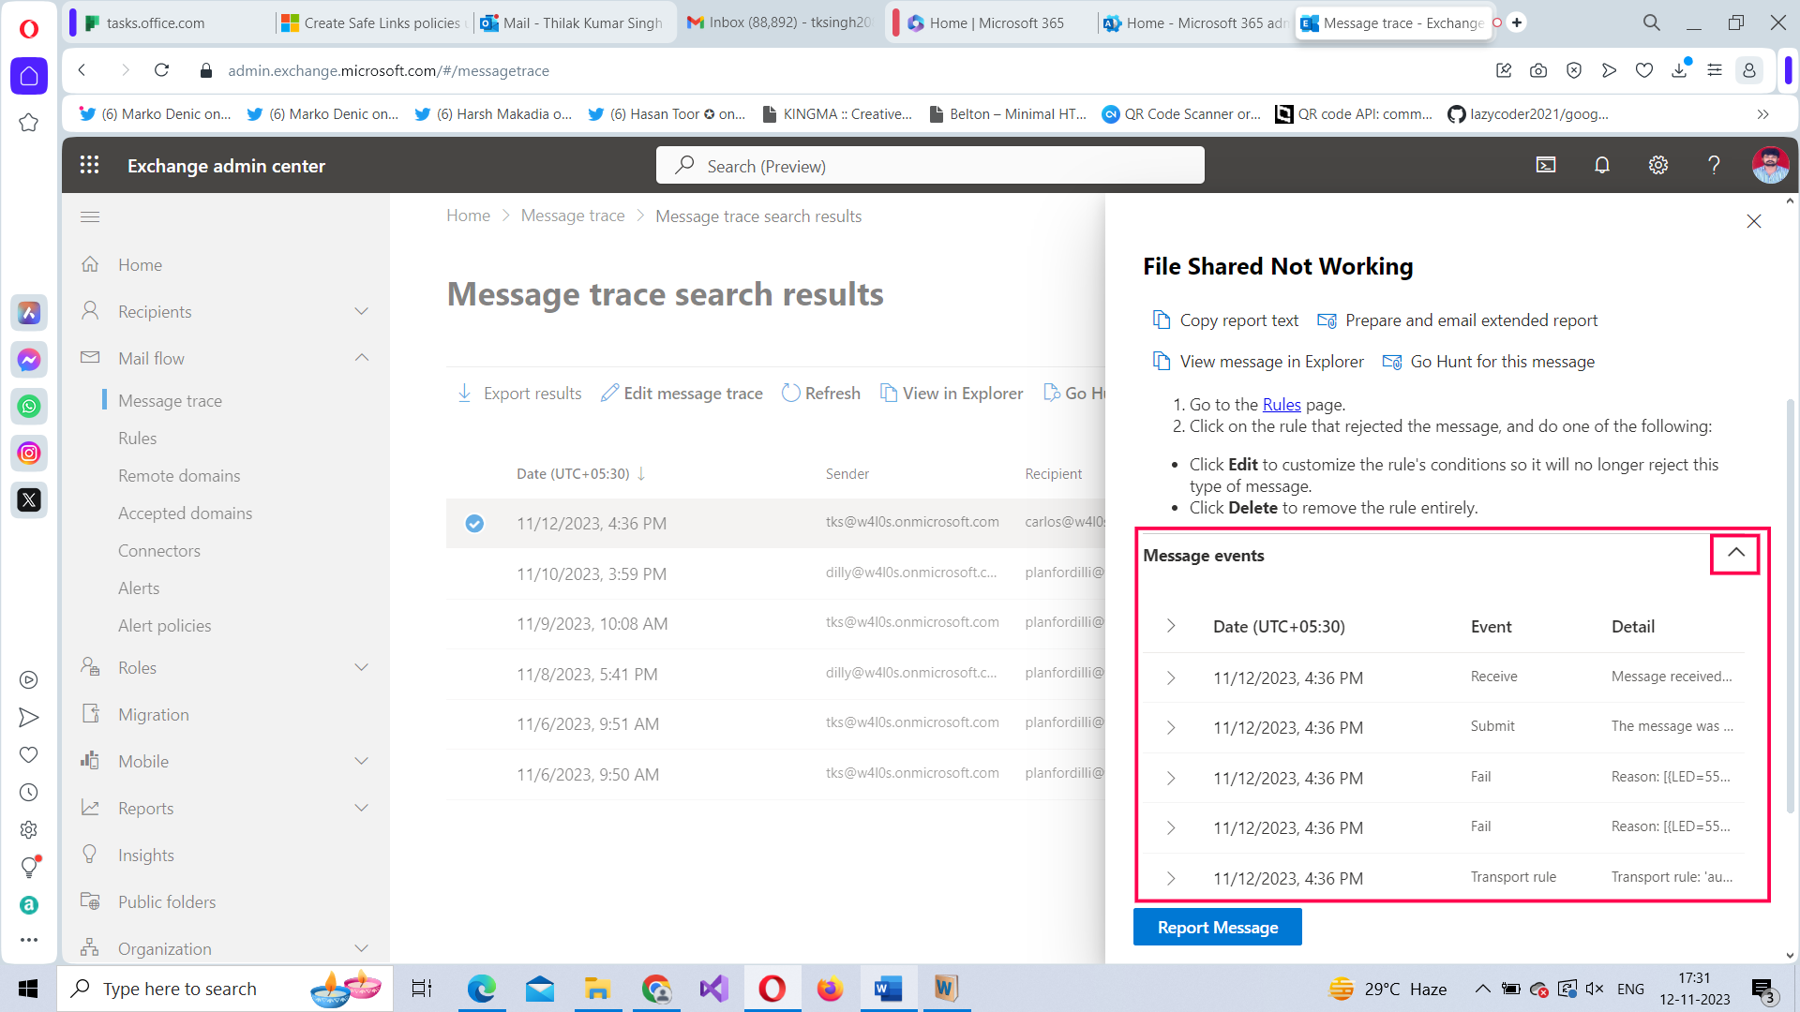
Note: The message events in this case were:
- Receive: The message was received by the Exchange server.
- Submit: The server submitted the received email.
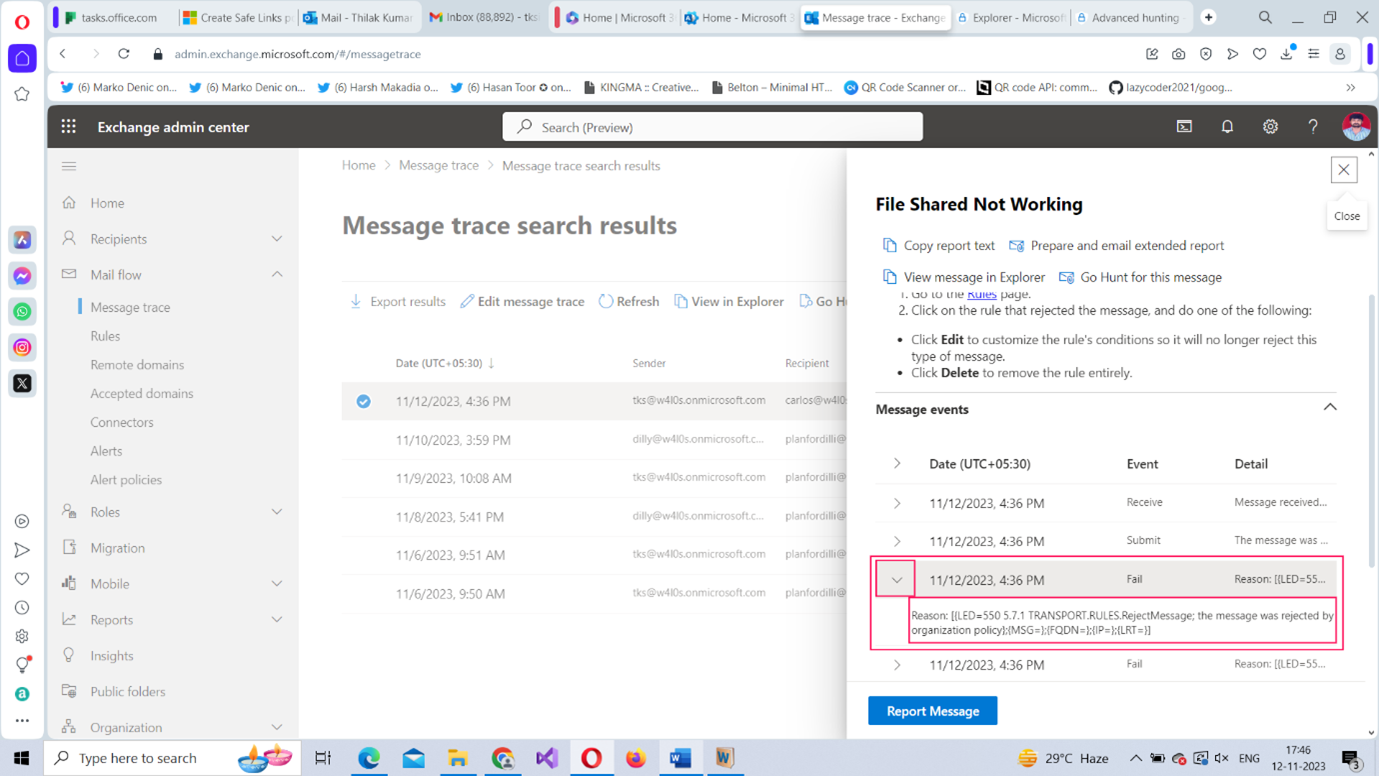
- Fail: The message failed because of the mail flow rule, as pointed out in Figure 23.
- If you select the More information dropdown, you’ll notice that the Message ID, Message size, and From IP address are listed, as shown in Figure 24.
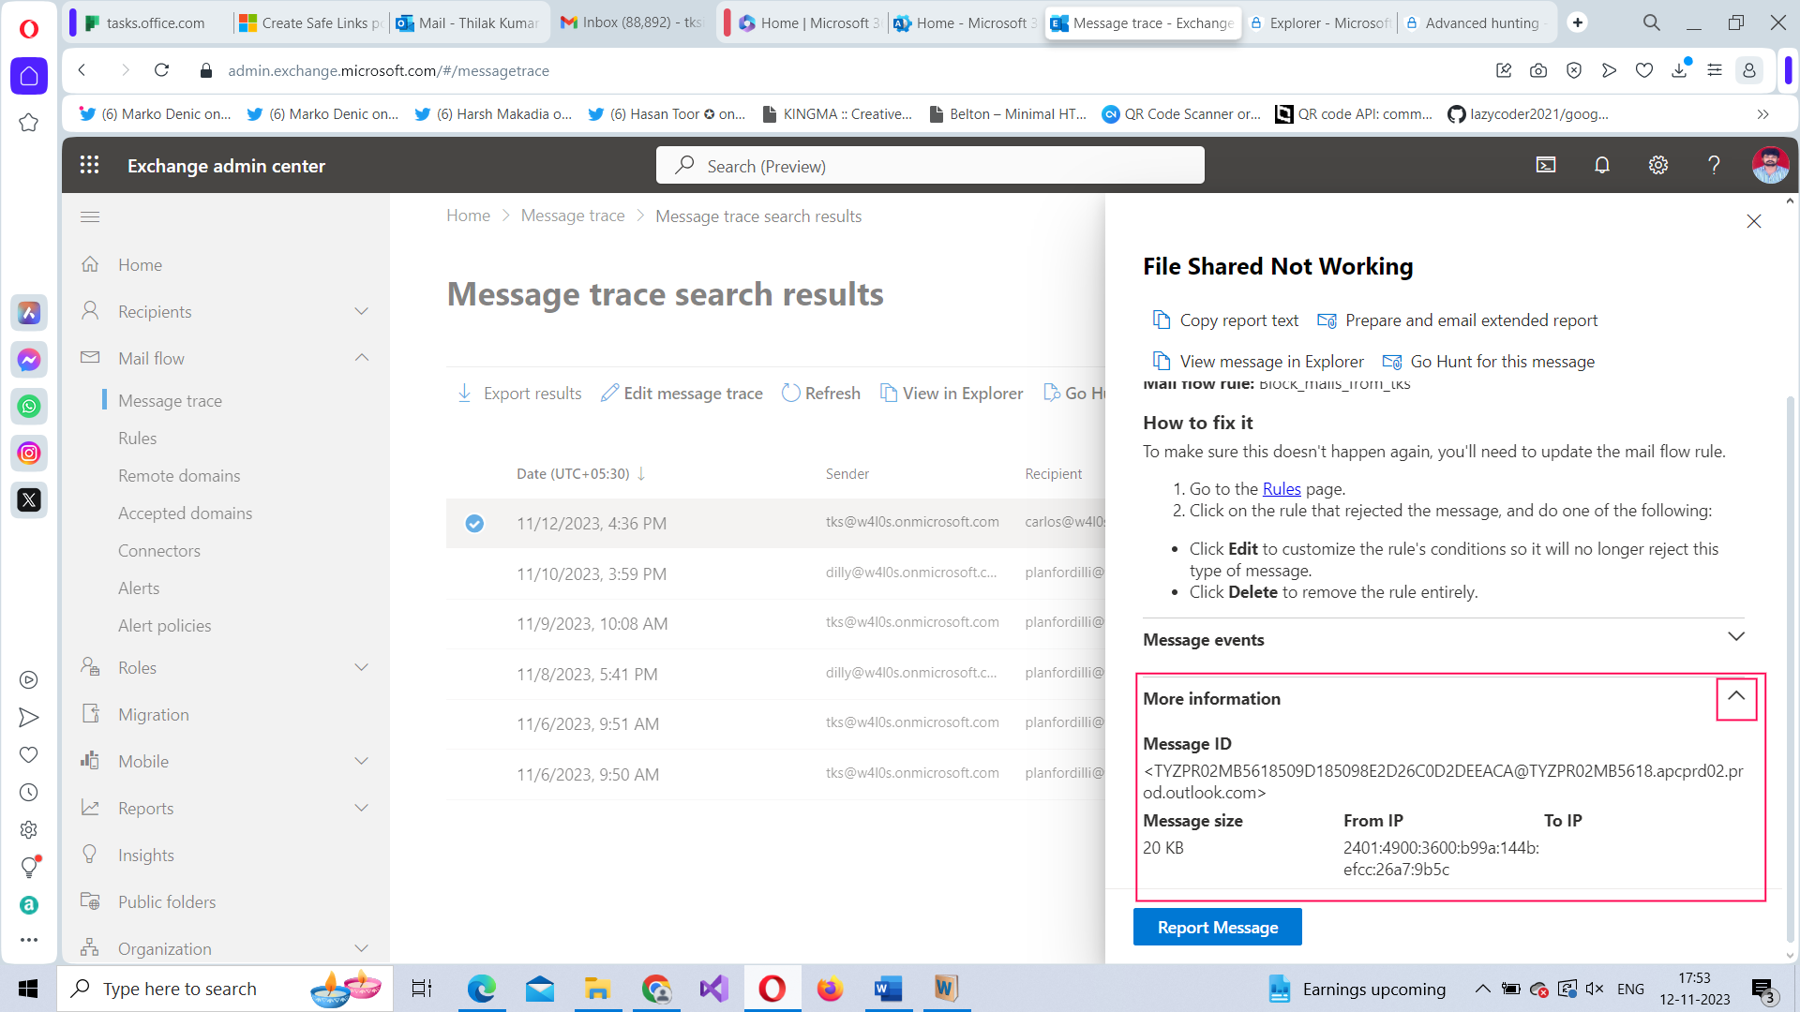
You are also presented with the following options:
- Copy report text: Copy the report text to a clipboard so that you can save it as a log file.
- Prepare and email extended report: Prepare and email yourself (or another admin) the extended report.
- View message in Explorer: Explore the message further in the Microsoft Defender Explorer page.
- Go Hunt for this message: Explore the message further in the Microsoft Defender Advanced Hunting page.
Running a Message Trace Using PowerShell
The Get-MessageTrace and Get-HistoricalSearch cmdlets help you run a message trace using PowerShell. The Get-MessageTrace cmdlet is the equivalent of generating a summary report using the EAC. That is, it cannot generate reports on messages older than ten days; the Get-HistoricalSearch cmdlet is the one you should use under such circumstances.
Prerequisites
- You should have Global administrator or Exchange administrator rights.
- You should know how to connect to Microsoft 365 Exchange Online with PowerShell.
Using the Get-MessageTrace Cmdlet
The Get-MessageTrace cmdlet helps you run a message trace in PowerShell. Just like with the EAC, it generates a report for two days by default, if you do not specify the time duration, as shown in Figure 26.
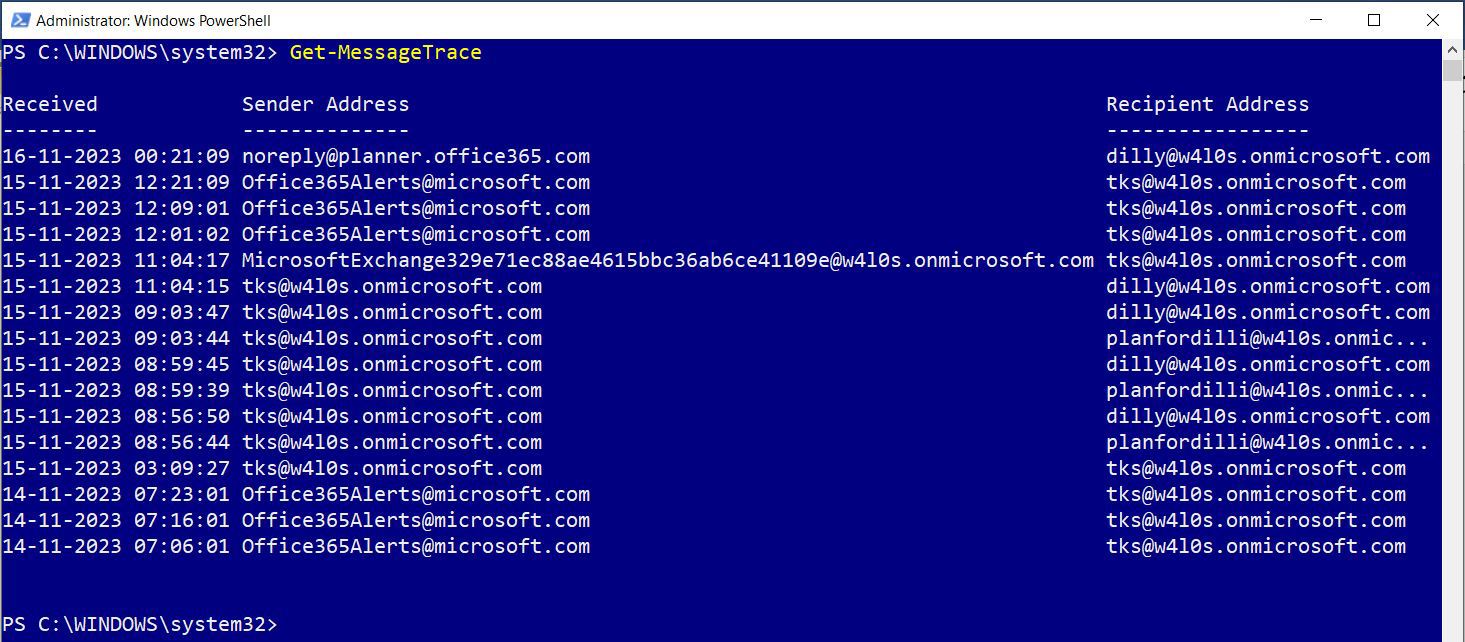
Cmdlet syntax: Get-MessageTrace
Passing Time Duration to Message Trace
You can pass the time duration to the -StartDate and -EndDate parameters of the Get-MessageTrace cmdlet, as shown in Figure 27.
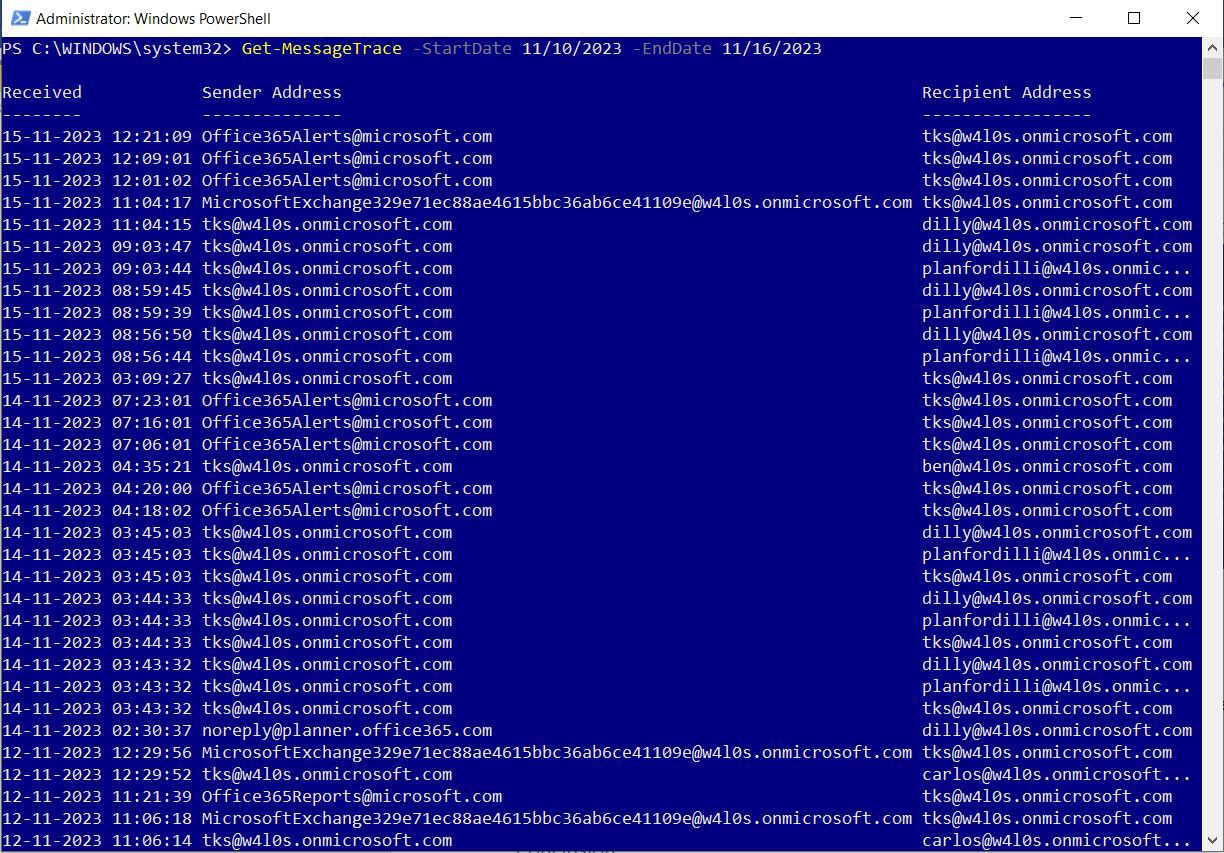
Cmdlet syntax: Get-MessageTrace -StartDate 11/10/2023 -EndDate 11/16/2023
Getting Failed Messages Only
If you want to fetch only the failed messages, pass in the -Status parameter with the value as Failed, as shown in Figure 28.
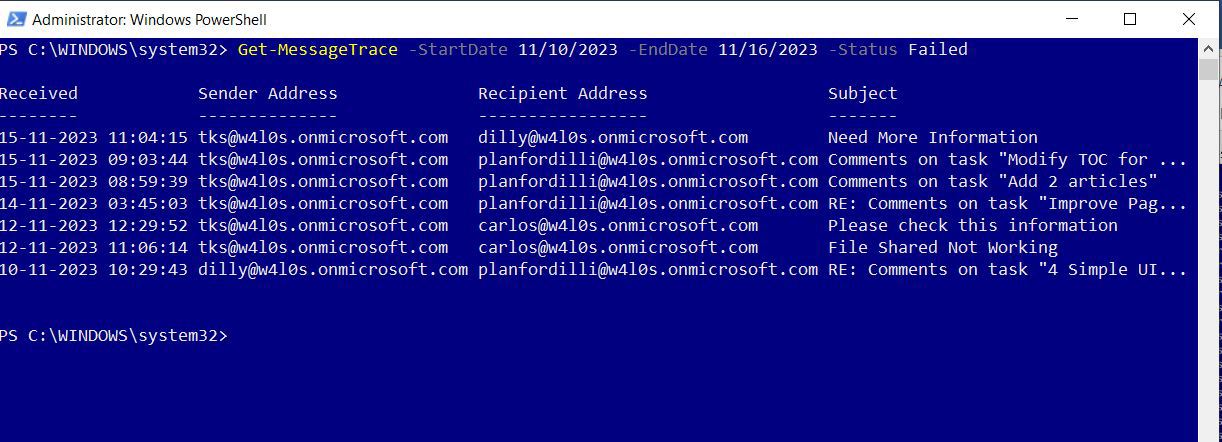
Cmdlet syntax: Get-MessageTrace -StartDate 11/10/2023 -EndDate 11/16/2023 -Status Failed
Note: Like with most PowerShell cmdlets, the Get-MessageTrace cmdlet may not return the MessageTraceId by default unless explicitly specified, as shown in Figure 29.
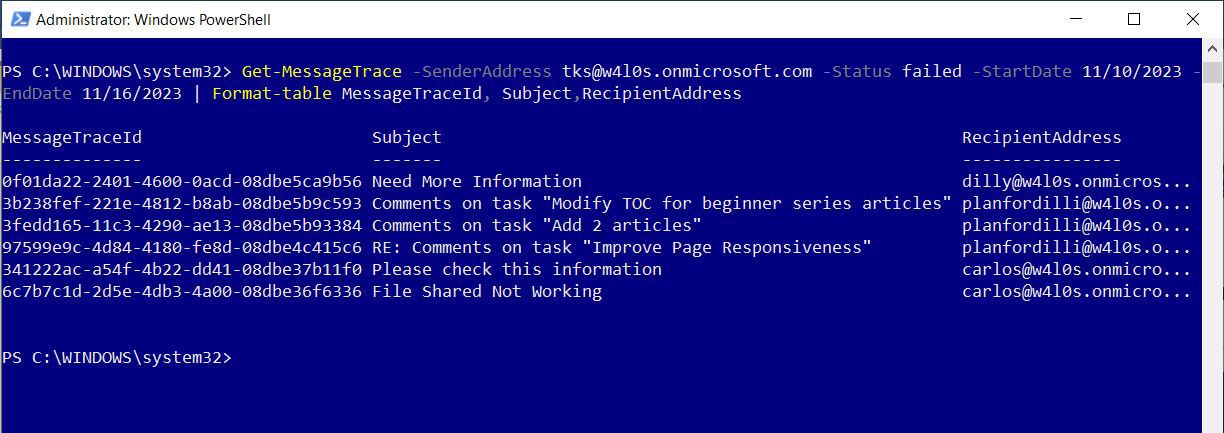
Cmdlet syntax: Get-MessageTrace -SenderAddress tks@w4los.onmicrosoft.com Status Failed -StartDate 11/10/2023 -EndDate 11/16/2023 | Format-Table MessageTraceId, Subject, RecipientAddress
Exploring the Failed Message Further
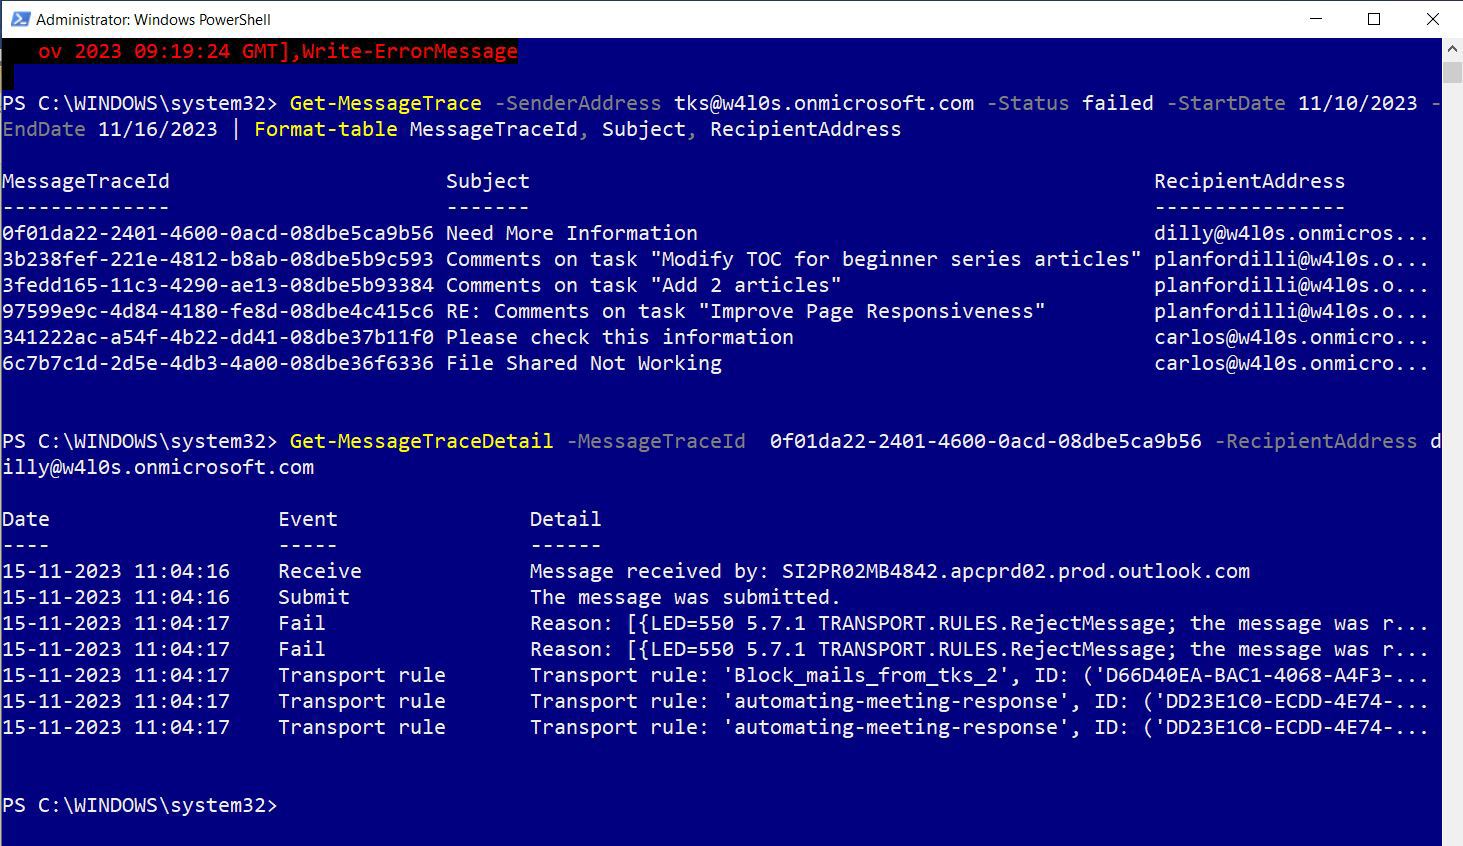
MessageTraceId helps you investigate the failed message further. By passing the MessageTraceId to the Get-MessageTraceDetail cmdlet, you can find out why the message failed. For example, Figure 30 shows that the mail flow rule was the reason behind the message failure.
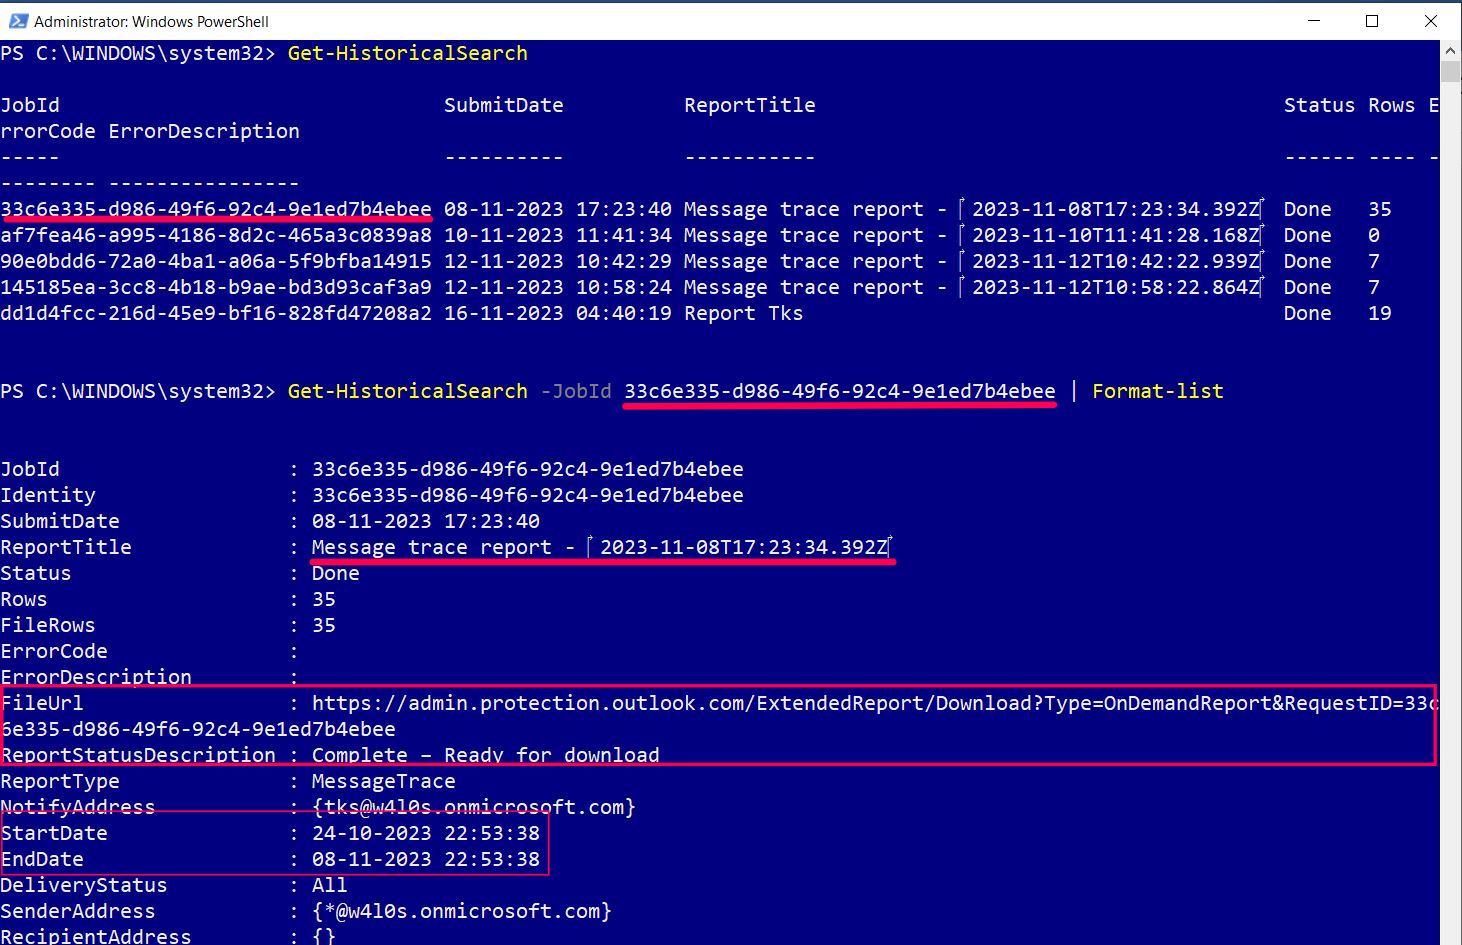
Using the Get-HistoricalSearch cmdlet
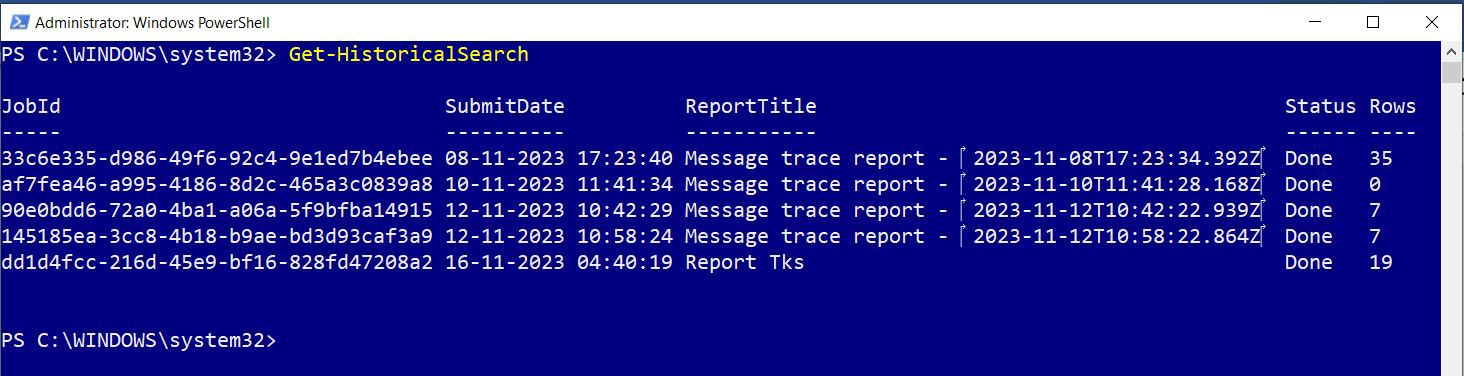
Get-HistoricalSearch can fetch message trace reports generated for messages older than ten days or more. In other words, it fetches the Enhanced summary reports and Extended reports that already exist in your tenant. You can see the data that the Get-HistoricalSearch cmdlet returns in Figure 31.
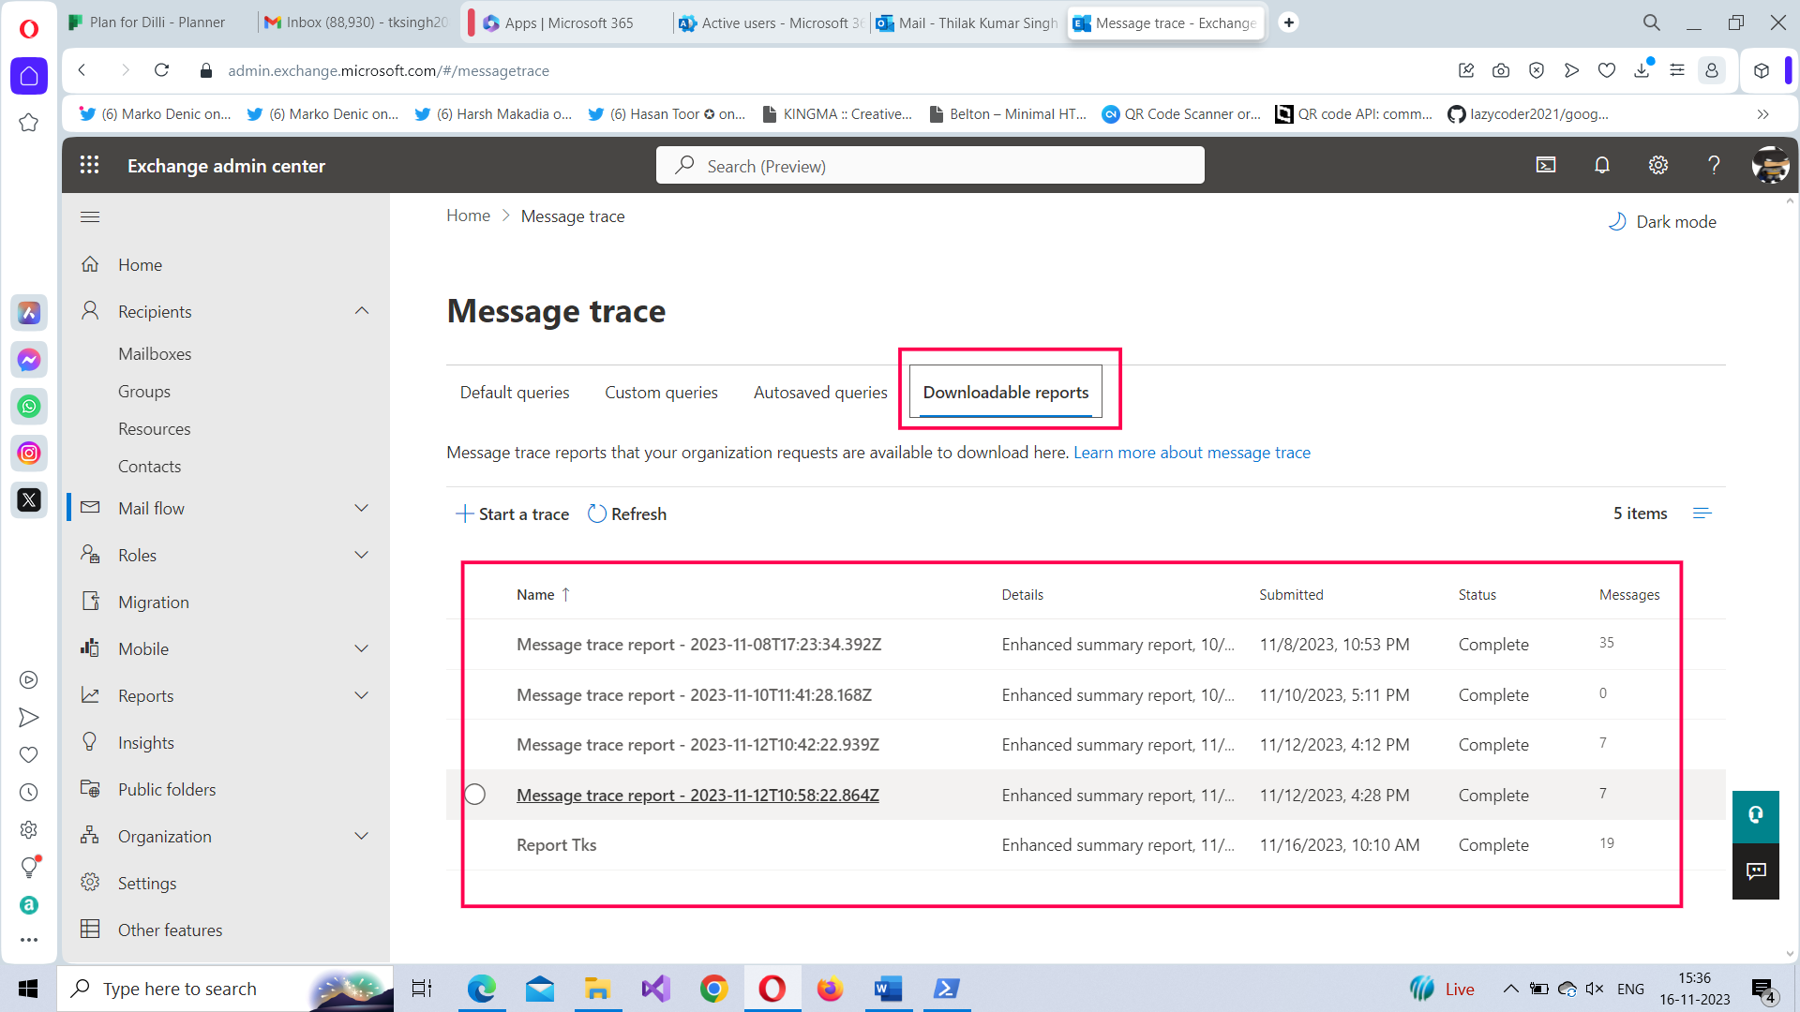
This data is the same data you see on the Downloadable reports tab of Message trace in the EAC, as confirmed by Figure 32.
Fetching Message Trace Report Details Using JobID
To fetch the message trace report details, pass the fetched JobId to the -JobId parameter, as shown in Figure 33. Remember to pipe the results to the Format-list cmdlet, since this will display a detailed response. You can also see from Figure 32 that the response contains the report download URL, report status, plus start and end date of the fetched report.
Starting or Running a Historical Search
The Start-HistoricalSearch cmdlet helps run message-trace reports for messages older than 10 days. You can start a message trace using the Start-Historical cmdlet, as shown in Figure 34.
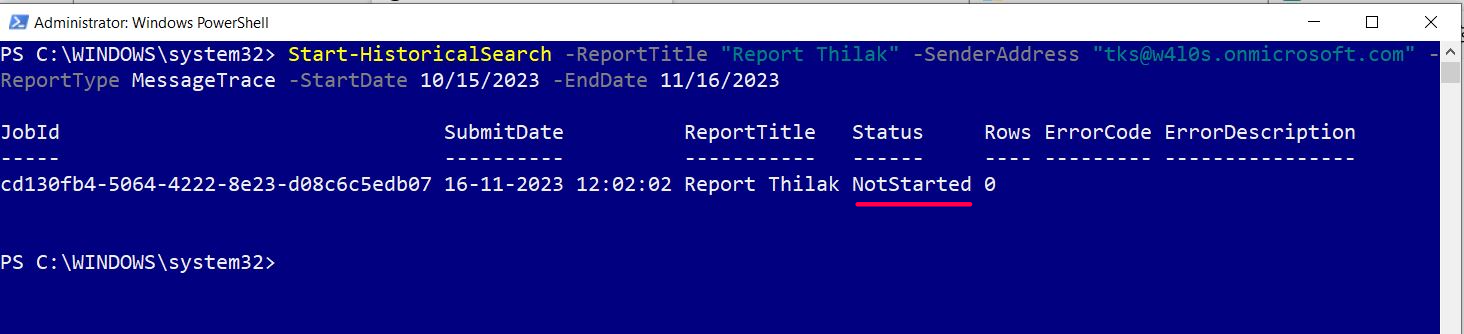
Cmdlet Syntax: Start-HistoricalSearch -ReportTitle "Report Thilak" -SenderAddress "tks@w4l0s.onmicrosoft.com" -ReportType MessageTrace -StartDate 10/15/2023 -EndDate 11/16/2023
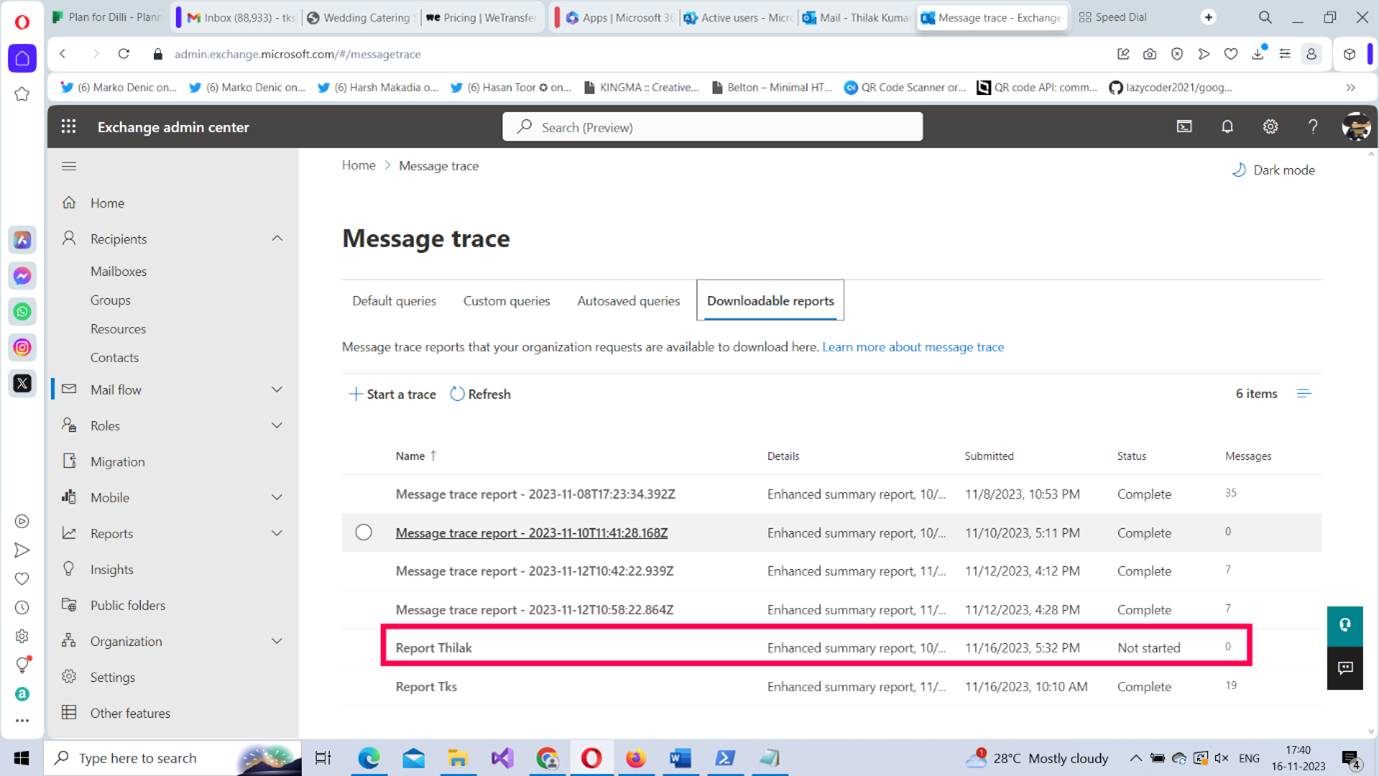
Though the report is being generated, it first appears with a NotStarted status. However, if you access the Downloadable reports tab in Message trace in the EAC, you’ll notice the report is listed as shown in Figure 35. You can safely assume that the report is being generated and that it will be available for download after a while.
Conclusion
Message trace helps you track down emails effectively. Whether to use the EAC or PowerShell is a matter of preference. Although PowerShell is usually preferred over the EAC interface, with message traces, you can’t tell the difference. Both are effective. So, the next time you face an undelivered mail issue, use message trace to resolve it.

Thilak Kumar Singh
Thilak Kumar Singh is a trainer who believes in teaching about IT in the simplest possible way with more emphasis on visual mode of learning. He firmly believes in democratizing IT knowledge, especially of Microsoft solutions, in which he specializes as a trainer and consultant.
He observes that in this era dominated by cloud computing and collaboration, where IT has reached users unimaginable hitherto, IT knowledge must not be an obscure science, but rather be available to anyone who wishes to engage with IT.