Formatting Rows and Columns in SharePoint Lists

I’ve been asked several times at events and by my clients, “How can I make columns or rows in SharePoint lists stand out from the others?” or “How can I make my odd and even rows different colors?” I always respond with questions of my own to ensure what the end goal is. Many times, clients think they need something custom or an app like Power BI to accomplish out-of-the-box list functionality. Usually, you can satisfy the requirement with some simple SharePoint list formatting. In this article, I will show how you can highlight key metadata, rows, and columns.
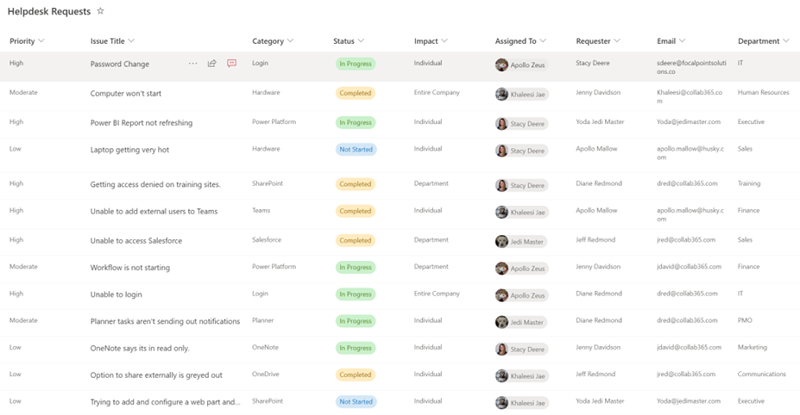
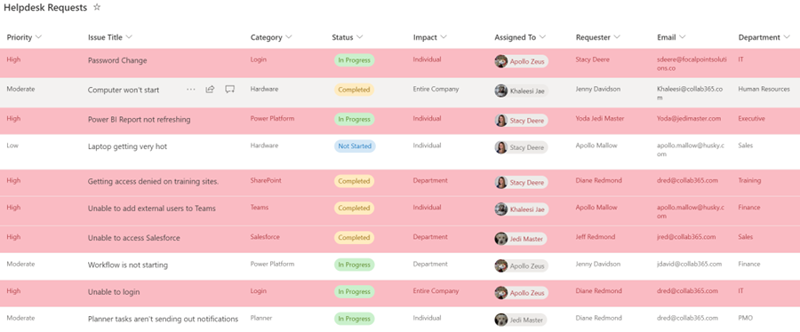
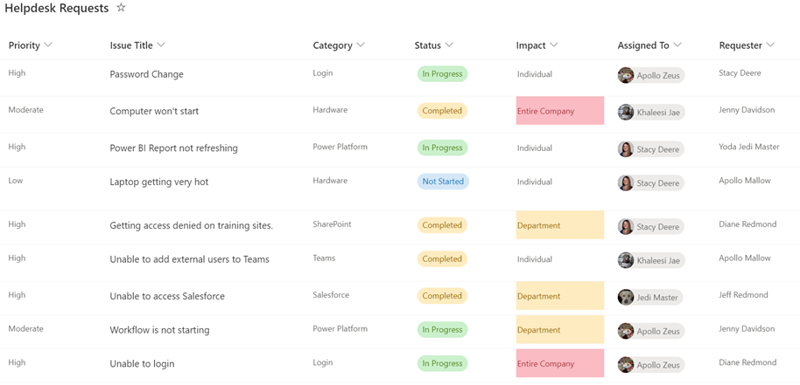
In the list that needs data to stand out, identify what the data criteria is. Figure 1 shows a SharePoint list with columns such as Priority, Status, and Impact, which hold information that’s significant to the Helpdesk Request process. This content would be ideal to highlight to distinguish it from the other informational fields.
View Formatting
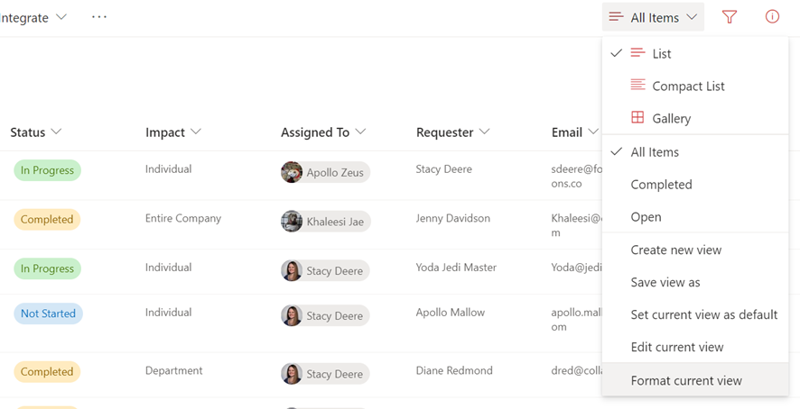
To format your view, first choose the metadata that needs to stand out. For example, if any items in the list have a priority of High, you can highlight those to ensure they are handled before the Low or Medium priority items. Once you know what you need to highlight, click the view options drop-down, ensure that List is selected, and then select Format current view, as shown in Figure 2.

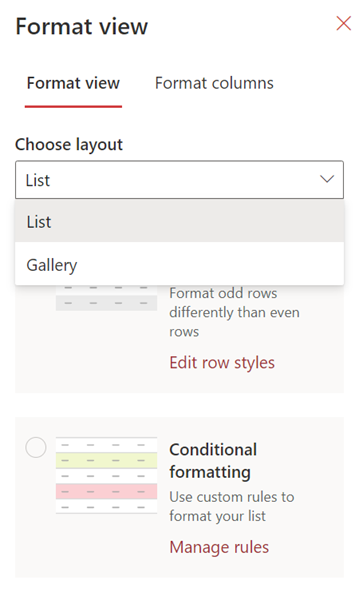
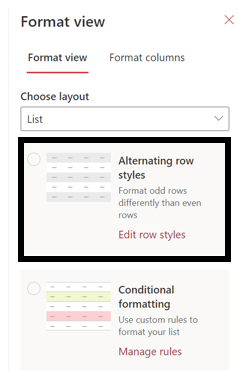
The Format view window opens, and two options appear for Choose layout: List or Gallery, as shown in Figure 3. List formats the standard list view (Figure 2, above).
Gallery View Formatting
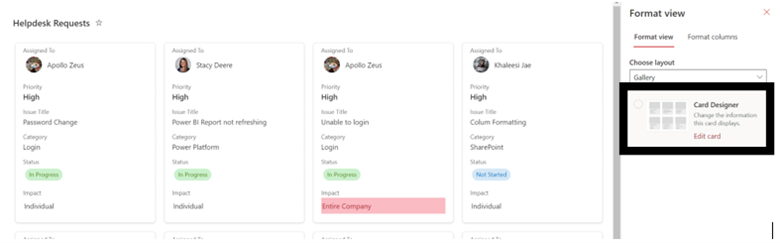
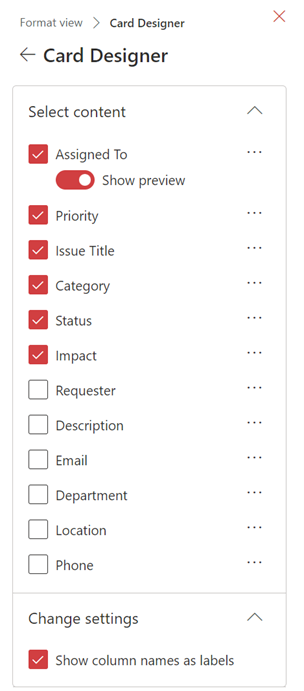
Gallery displays each list item as an individual card, much like a baseball card with player stats, as shown in Figure 4. To modify the content that displays on the cards, in Format view, click Edit card in Card Designer.

In Card Designer, you can select or clear the fields that you want to display in the cards and change the order in which they display, as shown in Figure 5, but you can’t highlight them. However, if you use the list view first to highlight your data, then switch to the gallery layout, the appropriate content will be highlighted (Figure 4, above, under Impact).
List View Formatting
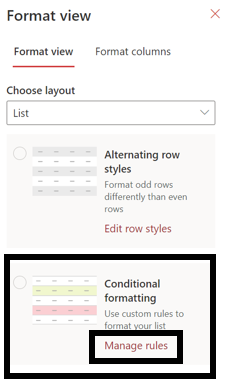
Under List, there are two options: Alternating row styles and Conditional formatting. In Alternating row styles, you can set the odd and even rows to different colors, as shown in Figure 6.
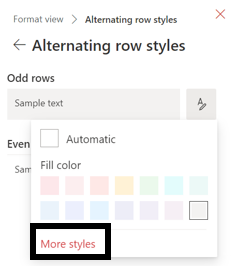
Selecting Edit row styles will provide you the option to choose the colors for your alternate rows. In addition, if you click More styles, as shown in Figure 7, you will see additional alternate row formatting options.
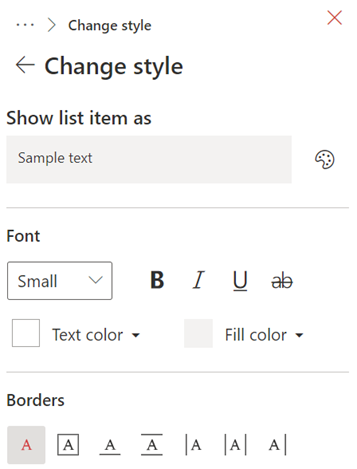
For example, you can choose font size, bold, underline, borders, and more, as shown in Figure 8.

The second option under the list layout is Conditional formatting. You can create custom rules based off the metadata in your list to apply the formatting that you require. After selecting Conditional formatting, click Manage rules, as shown in Figure 9.

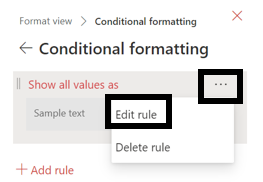
In Manage rules, you can configure the rules and formatting to apply to your list. Select the three dots and select Edit rule, as shown in Figure 10.

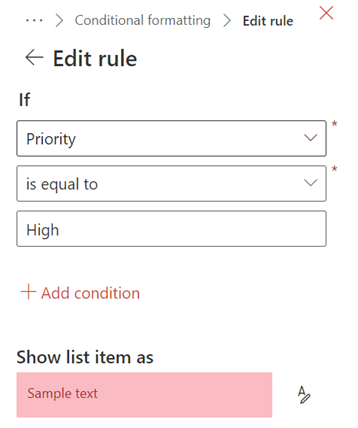
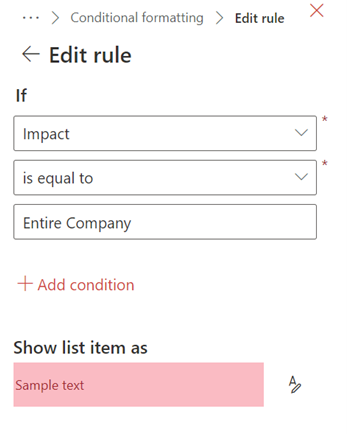
In the rule, fill out the If statement to create your condition, as shown in Figure 11. The first drop-down displays all the columns in use in the list. Choose is equal to or is not equal to. Next, add the value that you want to include in or exclude from the condition.
Note: The value is not a required field because it can be set to a null value. You can also create multiple conditions for a view by selecting Add condition.

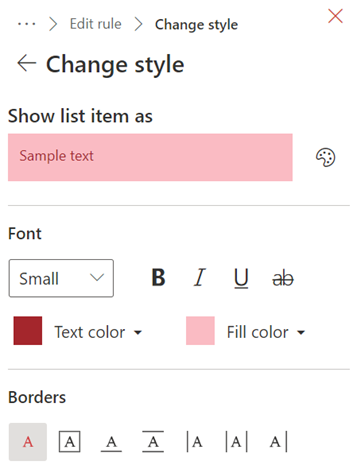
You can choose the text and fill color and additional formatting options, as shown in Figure 12.

When you select your formatting options, the list will start displaying them. Figure 13 shows our formatting example, where rows with Priority value of High are highlighted in red.
Column Formatting
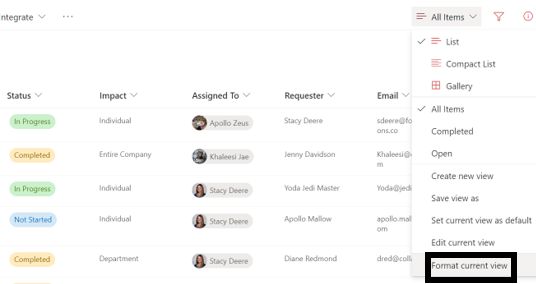
To highlight or format a column in a view, you have two options. Option 1 is to go to the view drop-down, and then select Format current view, as shown in Figure 14.
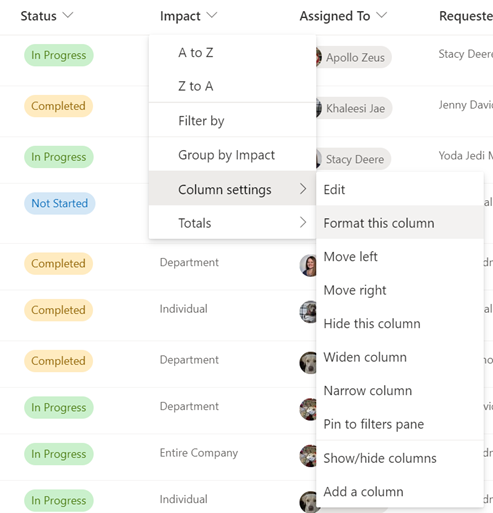
Option 2 is to go to the column, select the drop-down arrow beside it, select Column settings, and then select Format this column, as shown in Figure 15.

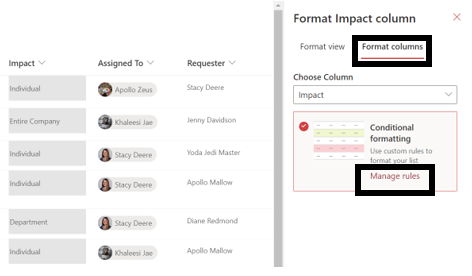
If you access the formatting options from the view drop-down, select Format columns, and choose the column that requires formatting from the drop-down, as shown in Figure 16. If you access the formatting options from the column drop-down, the formatting panel will already have these options set. If you selected the wrong column, you can change it here. To create a conditional formatting rule, select Manage rules.
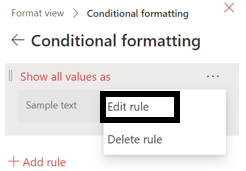
In Manage rules, you can configure the rules and formatting to apply to your list. Select the three dots, and select Edit rule, as shown in Figure 17.

In the rule, fill out the If statement to create your condition, as shown in Figure 18. The first drop-down will display all the columns in use in the list. Choose is equal to or is not equal to. Next, add the value that you want to include in or exclude from the condition.
Note: The value is not a required field because it can be set to a null value. You can also create multiple conditions for a view by selecting Add condition.

You can also choose the color and additional formatting options, as shown in Figure 19.
When you select your formatting options, the column will start displaying them. Figure 20 shows an example, where any items with impact of Entire Company or Department show in their respective chosen colors.

Summary
As you can see, there is so much more to formatting your lists than just adding pops of color for viewing. You have many ways to make your data tell a visual story for your organization. Capturing what is important, identifying flaws within a process, viewing data trends, and the list goes because the amount of potential to add formatting is limitless. Now go make your data tell a story and wow your organization.

Stacy Deere
Stacy Deere a Microsoft MVP and owner of Focal Point Solutions LLC, a Cincinnati, OH-based company that provides SharePoint and Microsoft 365 consulting. With 20+ years of experience in the IT industry, Stacy has mainly focused on collaboration solutions. She has numerous environment deployments, upgrades, migrations and many other SharePoint and M365 projects under her belt. The main focus of all projects is implementing the best solution for the organization and one that the users want and can easily utilize. Within the SharePoint community, Stacy is a Microsoft Office & Apps MVP, an author and is known for topics such as governance, user engagement, security & compliance, and Administration.