5 Ways to Track and Measure Productivity in Microsoft 365

In today's dynamic and digital-first corporate landscape, the role of digital productivity tools has never been more critical. As organizations strive to streamline their processes, foster collaboration, and drive business value, they often lean on robust ecosystems like Microsoft 365. Comprising a suite of versatile tools such as SharePoint, Microsoft Teams, OneDrive, Power Platform, Azure, and Exchange, Microsoft 365 has become a cornerstone of modern workspaces.
However, merely using these platforms is not enough. The real power lies in understanding how these tools are used, who is using them, and their impact on organizational effectiveness and efficiency. This is where the importance of tracking and measuring digital productivity comes to the fore.
How familiar are you with the digital productivity tools and metrics within the Microsoft 365 ecosystem? Most admins use one or more of these tools, but there continues to be a need for a comprehensive strategy for organizational productivity. Tracking and measuring the use of these digital resources doesn't just offer insights into operational patterns. Doing so also enables organizations to optimize processes, increase productivity, enhance collaboration, and drive overall organizational performance.
My goal in this article is to help IT administrators, digital transformation consultants, and business managers develop digital productivity tracking strategies to improve organizational performance and achieve business goals.
Let’s explore the Microsoft 365 ecosystem and its productivity metrics.
Organizing Your Data and Tools
As enterprises continue to evolve in response to the increasingly digital-first business landscape, Microsoft 365 is key to effective collaboration and productivity. To maximize its benefits, organizations must implement robust tracking and measuring methods for digital productivity. Let’s focus on five pivotal areas related to Microsoft 365 productivity tools and platforms.
1. Leverage Microsoft Adoption Score for Insights on Tool Usage
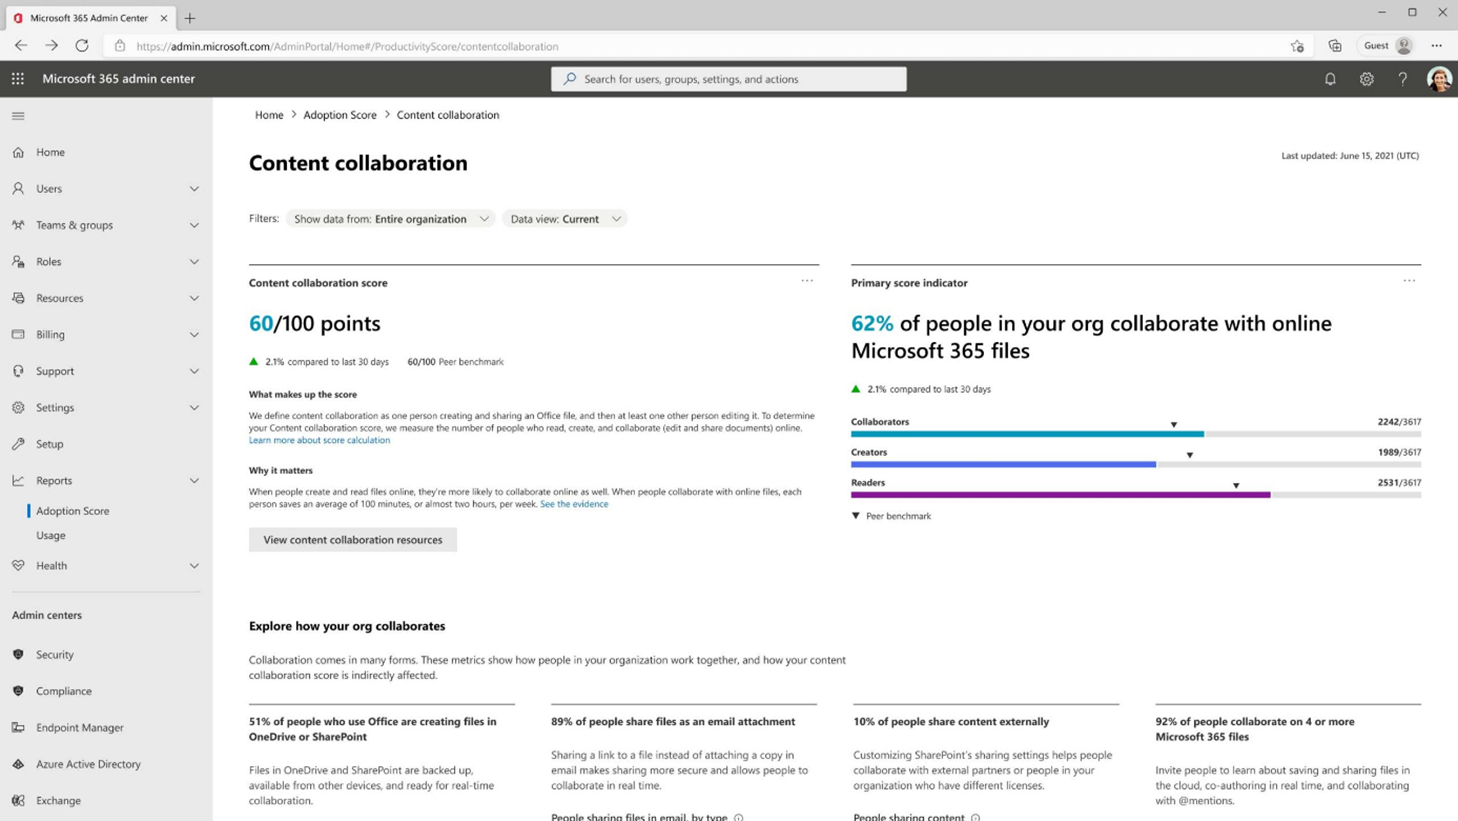
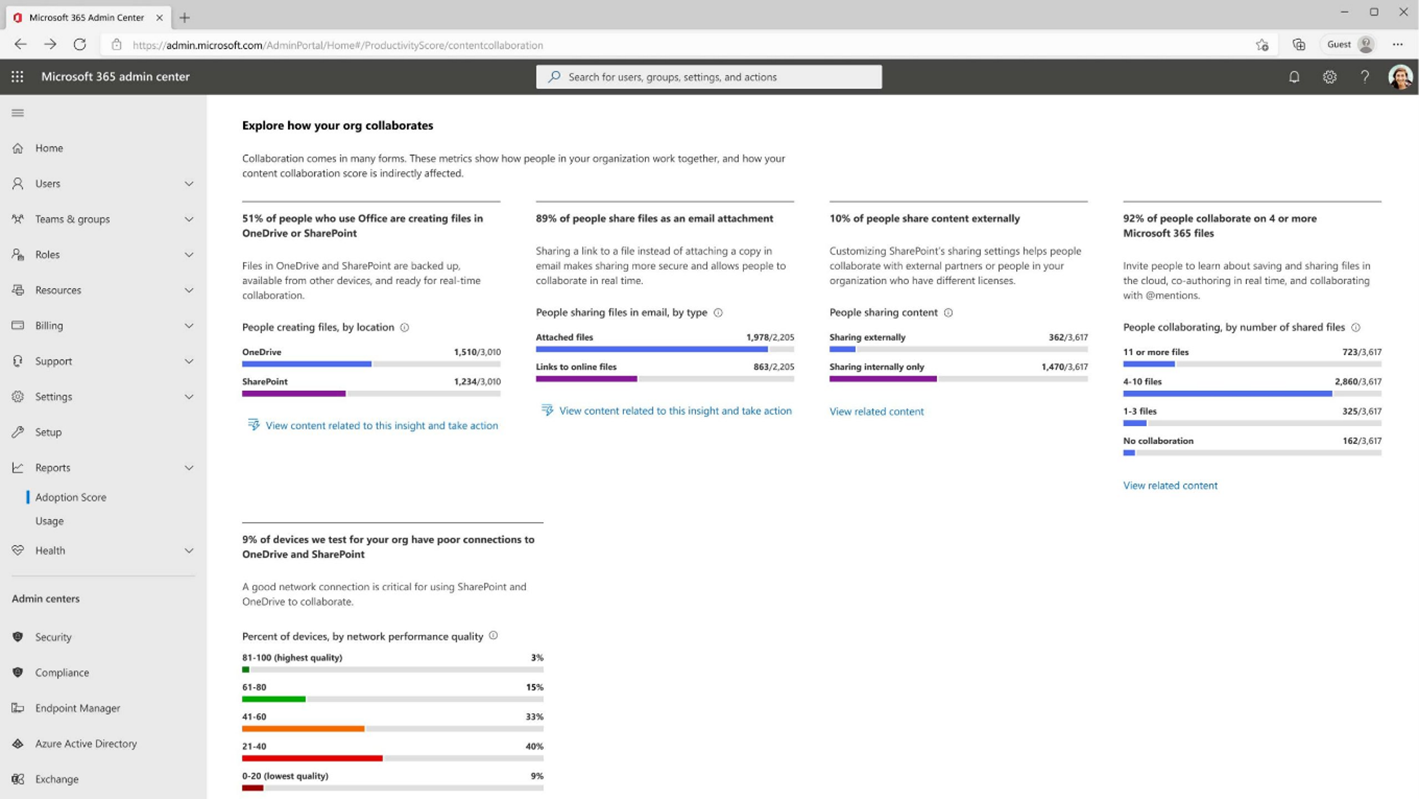
Microsoft Adoption Score, formerly known as the Microsoft Productivity Score, is an insightful tool within the Microsoft 365 admin center. It helps organizations understand their adoption levels of Microsoft 365 services by aggregating usage data related to communication, teamwork, mobility, and content collaboration. The score provides an in-depth, real-time view of the utilization of tools like SharePoint, Teams, Exchange, and OneDrive.
Adoption Score reveals which tools are popular, which ones are underused, and how these trends evolve over time. This analysis helps organizations understand their collaboration habits and provides valuable context on their digital adoption performance.
Adoption Score also identifies areas for improvement. For instance, if Teams is underused, an awareness campaign could enhance its adoption. Understanding usage trends, such as peak times for SharePoint, helps manage load and maintain performance. The score also guides training initiatives by highlighting underused features, enabling targeted training to enhance employee proficiency.
Not a mere static metric, Adoption Score is an ongoing reflection of an organization's digital evolution. Regular monitoring helps track progress, gauges the impact of implemented initiatives, and refines digital transformation strategies.
2. Get Reports in the Microsoft 365 Admin Center to Optimize Tool Usage
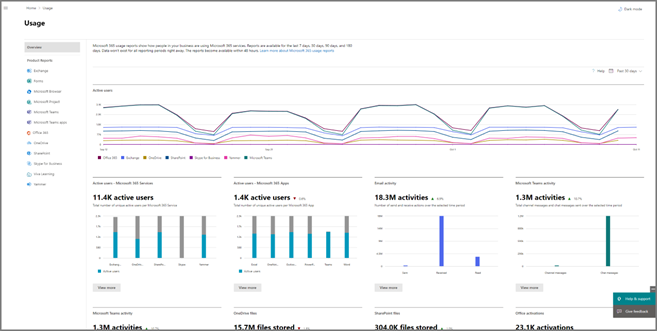
The Microsoft 365 admin center gives IT administrators and decision-makers comprehensive reports on platform usage, making it a crucial hub for understanding and optimizing digital productivity.
Exchange reports provide detailed insights into email traffic patterns, such as inbound and outbound mail flow, email delivery status, and distribution across the organization. These reports include data on malware and spam, assisting in the safeguarding of communication networks.
SharePoint reports enable assessment of document collaboration. They offer insights into the use of SharePoint for document storage, editing, and sharing. Tracking user activity and observing usage trends allows strategies to be developed to enhance SharePoint use and collaboration.
Teams reports deliver insights into communication patterns within an organization. They show the frequency and types of interactions by user for a granular understanding of engagement. This data can guide training and policy updates and help identify superusers.
Regular monitoring and analysis of these reports is essential for maximizing the value of Microsoft 365. Trends and potential issues can be identified, informing IT resource planning and enabling swift rectification of problems.
The insights derived from the admin center reports support data-driven decision-making, informing strategies for IT resource allocation, training, and support initiatives. They play a crucial role in shaping an efficient digital workspace tailored to an organization's unique needs.
For administrators, the admin center's reporting capabilities are indispensable for optimizing the use of Microsoft 365 tools. Through informed analysis, businesses can enhance their digital productivity, ensure efficient resource usage, and drive continual improvement in their digital workspaces.
3. Dive Deep into Your Microsoft 365 Analytics by Using Windows PowerShell and Power BI Reporting
Microsoft 365's native analytics offer key insights into platform usage, but to dig deeper, PowerShell and Power BI provide enhanced granularity and customization.
PowerShell, Microsoft's task automation and configuration management framework, allows granular control over Microsoft 365 via cmdlets. IT administrators can extract raw usage and activity data from Microsoft 365 that isn't immediately accessible through the admin center. This can range from detailed user-level data to complex information about specific interactions within Teams or SharePoint. For example, the following code and figure show a PowerShell script for tracking users with multiple licenses.
$userVPN="<user account UPN>"
$allLicenses = Get-MgUserLicenseDetail - UserId $userUPN -Property SkuPartNumber, Service
$allLicenses | ForEach-Object {
	Write-Host "License:" $_.SkuPartNumber
	$_.ServicePlans | ForEach-Object {$_}
}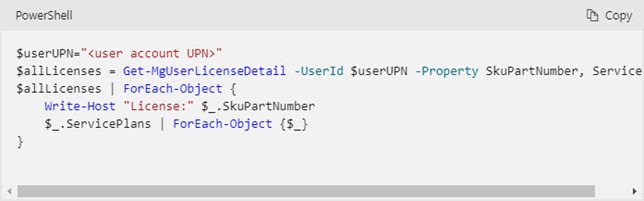
Power BI, Microsoft's data visualization and business intelligence tool, transforms raw data into meaningful insights via interactive visualizations. After data extraction from Microsoft 365 via PowerShell, it can be imported into Power BI and transformed into diverse, visually appealing reports and dashboards. Power BI offers an intuitive interface, supports filtering and drilldowns for detailed data exploration, and allows easy sharing of reports among stakeholders. These capabilities facilitate data-driven decision-making across the organization.
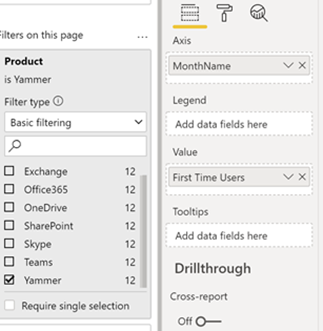
| Used with permission from Microsoft. View Full Size
The pairing of PowerShell's data extraction and Power BI's visualization delivers comprehensive Microsoft 365 analytics, providing in-depth insights into user activity, data usage, and collaboration patterns. For example, data about SharePoint site usage extracted with PowerShell can be visualized with Power BI, unveiling trends that inform decisions about resource allocation, training needs, or policy updates.
While Microsoft 365's built-in analytics are valuable, the combined power of PowerShell and Power BI offers a more detailed, customized understanding of digital productivity. These tools enable organizations to delve deeper into their productivity metrics and make informed decisions to enhance efficiency and effectiveness.
4. Use Viva Insights for Data on Personal and Organizational Collaboration
In the digital transformation era, understanding productivity and wellbeing has become paramount. Microsoft Viva Insights provides data-driven, privacy-protected insights to aid individuals and organizations.
On the personal level, Viva Insights offers individualized insights into work habits, including meeting time, work hours, focused work time, and after-hours work. These insights are private, visible only to the individual, suggesting ways to improve personal productivity and wellbeing. For instance, Viva Insights might suggest scheduling late-night emails for the next workday or remind individuals to take breaks between meetings.

| Used with permission from Microsoft. View Full Size
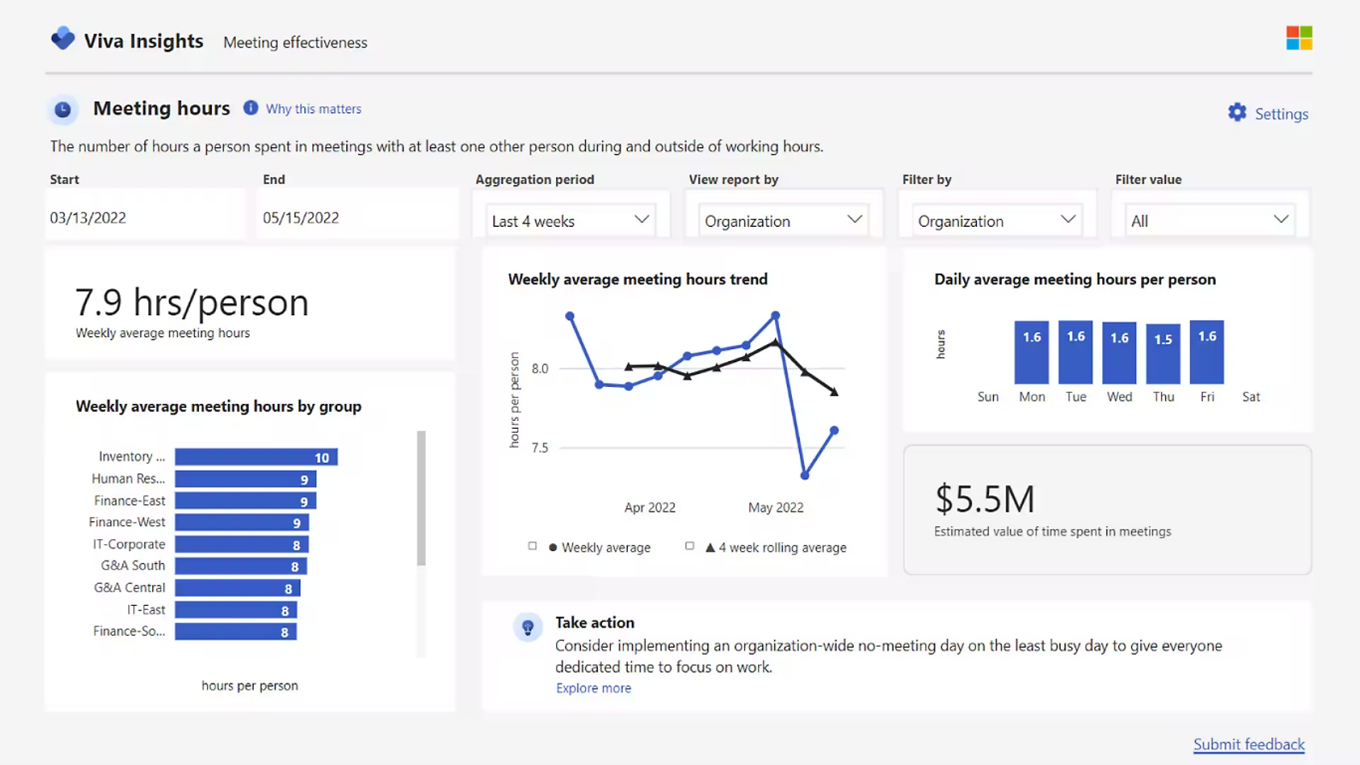
Organizationally, Viva Insights provides aggregated, anonymized trends on collaboration, workload distribution, and meeting culture, providing a comprehensive view of work practices. This perspective helps leaders identify bottlenecks, inefficiencies, and burnout risks. For example, it might indicate a need to shift from longer, poorly attended meetings to shorter, focused sessions, or highlight departments with high after-hours work, pointing to workload-balance issues.
These insights help leaders make informed decisions about work policies, resource allocation, and wellbeing initiatives, while maintaining privacy by not identifying specific users' data. The result is a healthier, more balanced digital workplace.
As part of Microsoft 365, Viva Insights uses a broad range of data to provide comprehensive insights, reflecting Microsoft's commitment to fostering modern, productive, healthy workplaces. Undoubtedly, Viva Insights can be a crucial tool for organizations seeking to boost productivity while prioritizing wellbeing. By using this tool, organizations can cultivate a more self-aware, balanced, and effective workforce.
5. Prepare for Microsoft Copilot and Other AI Features by Preparing Your Data Now
Artificial Intelligence (AI), with features like Microsoft Copilot, is set to redefine digital productivity by streamlining workflows with context-aware assistance. However, maximizing these emerging AI capabilities necessitates robust, well-structured data, hence the need for robust data governance.
AI features like Microsoft Copilot leverage machine learning to analyze user behavior and data patterns. They offer proactive assistance like predicting user needs, automating tasks, and providing real-time insights, which enhances productivity.
To function effectively, these AI tools need high-quality, accessible data. Poorly structured data can prevent AI tools from generating valuable insights. Therefore, a robust data governance strategy is crucial, covering:
- Data quality: Accurate, reliable, updated data is crucial to avoid misleading AI insights or predictions.
- Data consistency: Uniform data formats, naming conventions, and handling practices across the organization are essential.
- Data security: Strict security protocols, privacy regulations compliance, and controlled data access are critical.
- Data accessibility: AI tools need readily accessible data, balanced with appropriate access controls.
By implementing sound data governance today, organizations can prepare to exploit AI's potential as it evolves. Given that the effectiveness of AI hinges on the quality of data it learns from, investing in data governance equates to investing in future productivity.
With the impending AI revolution in digital productivity, prioritizing data governance becomes essential. Ensuring data quality, consistency, security, and accessibility allows businesses to fully utilize the power of AI tools like Microsoft Copilot, driving productivity to unprecedented levels.
Conclusion
By focusing on these five areas, organizations can harness the full potential of the Microsoft 365 ecosystem and cultivate continual improvement. In a digital-first world, understanding and optimizing digital productivity isn't just a nice-to-have. It's a critical component of an organization's strategic toolkit. Tracking and measuring digital productivity is key to remaining agile, competitive, and future-ready in our evolving business landscape.

Christian Buckley
Christian is a Microsoft Regional Director (RD) and Most Valuable Professional (MVP), an award-winning product marketer, technology evangelist and host of the #CollabTalk podcast and monthly tweetjam series. Christian's 30-year tech career has included Chief Marketing Officer and Chief Evangelist for several leading SharePoint ISVs, and he was part of the Microsoft team that launched the hosted SharePoint platform in Office 365. He has worked with some of the world’s largest technology companies to build and deploy social, collaboration, and supply chain solutions, and he sold his first software startup to Rational Software in 2001. A co-author of books on both SharePoint and software configuration management (SCM), Christian is one of the most widely published names within the Microsoft ecosystem.