Training a Time-Series Forecasting Model Using Automated Machine Learning

Have you ever found yourself stranded on the side of the road, hood raised, staring at a dead car battery? It’s a universal frustration – one that disrupts your daily routine and leaves you pondering how you could have avoided this inconvenience. Imagine a different scenario: your car, like a trusted companion, whispers to you weeks in advance, “Hey, your battery’s fading. Let’s plan a replacement.” This is not science fiction; it’s the power of time-series forecasting and automated machine learning (AutoML) in action.
In the dynamic landscape of machine learning, time-series forecasting plays a pivotal role. Whether predicting stock prices, weather patterns, or patient vital signs, understanding temporal data unlocks valuable insights. Time series analysis is becoming increasingly important with the advent of Industry 4.0. Using time series data to predict when equipment will require maintenance before a failure occurs, drives operational efficiency and strategic decision-making in the manufacturing industry.
In this article, you will learn the intricacies of machine learning for time-series analysis, explain relevant concepts, address common pitfalls, and show how to successfully train a simple time series forecasting model using the Azure Automated Machine Learning (AML) Studio without any code.
Major Topics in Training a Time-Series Forecasting Model Using Automated Machine Learning
- Basic terms: I will define key concepts in time-series analysis.
- Technical applications: I will tell you ways that industry can apply machine learning and extract valuable insights.
- Forecasting algorithms: I will discuss different algorithms used for forecasting.
- Error metrics: I will examine how to measure the accuracy of forecasts.
- Workflow: I will outline the steps involved in the machine learning workflow for time-series forecasting.
- Pitfalls and best practices: I will highlight common challenges in time series forecasting and how to avoid them.
- Activity: I’ll walk you through an example of how to predict the lifespan of vehicle batteries using the Azure AutoML studio by training a simple linear regression model effortlessly.
- Conclusion: I will reflect on the importance of AutoML in time-series forecasting.
- Further reading: I have provided resources for those who wish to go further in this quest.
Basic Terms Associated with Training a Time-Series Forecasting Model Using Automated Machine Learning
Here are key concepts in time-series analysis that I’ll touch on in this article.
Time Series and Forecasting
A time series is a sequence of data points collected at regular intervals over time. You can think of it as a historical record – a timeline capturing everything from stock prices and weather patterns to sensor readings and customer behaviours. Time series forecasting involves using this historical data to predict future events or trends. It’s like gazing through a rearview mirror to navigate the road ahead.
- Trend: The underlying direction in which the data is moving over time.
- Seasonality: Regular patterns or cycles observed within specific time intervals.
- Stationarity: A time series whose statistical properties do not change over time.
- Autocorrelation: The correlation of a time series with its past and future values.
- Lag: The amount of time between two related occurrences within the time series data.
Temporal Dependencies
Time series data exhibits inherent dependencies. Each observation relies on its past values. Whether analysing hourly website traffic or monthly sales, understanding these dependencies is fundamental for accurate modelling.
Automated Machine Learning (AutoML)
AutoML simplifies the complex dance of machine learning. It’s the democratization of AI, allowing no-code solution lovers and non-experts to harness its power. For time-series forecasting, AutoML automates model selection, feature engineering, and hyperparameter tuning. In other words, it takes care of the nitty-gritty, leaving us with actionable insights.
Technical Applications within Machine Learning for Time Series
Let’s explore some technical applications within machine learning as it relates to time series:
- Curve Fitting: Imagine fitting a curve to scattered data points. It’s like finding the best-fitting line through a cloud of dots. Curve fitting helps us understand underlying trends and patterns.
- Regression: Predicting continuous outcomes – whether it’s tomorrow’s temperature, stock prices, or the lifespan of a car battery. Regression models help to capture these relationships.
- Classification: Categorizing data into predefined classes. In time series, this might involve classifying stock market movements as bullish or bearish.
- Forecasting: This is similar to peering into the crystal ball. It deals with questions or fears like, “Will sales spike during the holiday season?” Forecasting algorithms predict future data points based on historical patterns.
- Segmentation/Clustering: Grouping similar data points. Imagine clustering customers based on their purchasing behaviours or identifying distinct seasons in temperature data.
- Anomaly Detection: Spotting the odd one out. Anomalies – whether sudden spikes in website traffic or irregular heartbeats – deserve attention.
- Reinforcement Learning: Learning through trial and error. Reinforcement algorithms optimize decisions, like when to charge an electric vehicle to maximize efficiency.
Forecasting Algorithms Used in a Time-Series Forecasting Model Using Automated Machine Learning
Let me briefly explain some forecasting algorithms that are applied in time series forecasting:
- Regression algorithm: Models the relationship between variables. Linear regression is a workhorse here, and I will use this algorithm in this article.
- AR (Autoregressive Model): The AR model predicts future values based on past values. It assumes that the current observation is related to its previous observations, with the influence of past values diminishing over time. This model is useful when there’s a clear trend or seasonality in the data.
- MA (Moving Average Model): The MA model uses past forecast errors to predict future values. Instead of using past values of the variable itself, it focuses on past errors to capture random fluctuations in the time series. This helps smooth out noise and highlight underlying trends.
- ARMA (Autoregressive Moving Average Model): The ARMA model combines both AR and MA models. It incorporates autoregressive terms (past values) and moving average terms (past errors) to predict future values. This model is suitable when the data exhibits properties of both AR and MA models.
- ARIMA (Autoregressive Integrated Moving Average Model): ARIMA takes it up a notch. It includes differencing (the “I” part) to make the time series stationary (i.e., removing trends and seasonality). ARIMA combines autoregressive, moving average, and differencing components to handle a wide range of time series patterns including trends and seasonality.
- Prophet: Relax! It is not the mystical kind, though. Prophet handles seasonal effects, making it ideal for business forecasts.
- Exponential Smoothing: A technique that applies decreasing weights to past observations.
- Multivariate Regression: This can be likened to multiple predictors. It’s like juggling several balls – each representing a variable.
- Recurrent Neural Network (RNN): This can be likened to memory-laden models. They process sequences of data, making them perfect for time series.
- Forecast Temporal Convolutional Network (FTCN): FTCNs use convolutional layers for forecasting. Picture a neural network sifting through time.
Note: Each algorithm has its strengths and weaknesses, and selecting the appropriate one depends on the specific problem and data characteristics.
Error Metrics for Time Series Forecasting
Performance measurement matters and evaluating the performance of machine learning models for time series forecasting is crucial. Error metrics for time series help us measure the accuracy of our predictions. Key error metrics include:
- Forecast Error: Also called prediction or residual error. It is the difference between observed and predicted values. Smaller errors mean better forecasts.
- Mean Squared Error (MSE): It averages the squares of forecast errors. A low MSE indicates accurate predictions.
- Root Mean Square Error (RMSE): The square root of MSE. It’s our trusty yardstick for model goodness.
- Mean Absolute Error (MAE): Averages the absolute forecast errors. It’s robust and less sensitive to outliers.
- Mean Absolute Percentage Error (MAPE): The mean absolute percentage difference between the forecasted and observed values.
Note: Understanding these metrics is vital to selecting the best algorithm and optimizing hyperparameters. For instance, MSE and RMSE are sensitive to outliers, while MAE is more robust.
Machine Learning Workflow for Time Series Forecasting
Let’s provide a high-level overview of the machine learning workflow for time series forecasting and cross-validation:
- Data Collection involves gathering historical data points relevant to the problem over time and ensuring data quality and consistency.
- Data Preprocessing involves cleaning and transforming data. Handle missing values and outliers. Also, it involves normalizing or scaling the data.
- Model Selection involves choosing appropriate algorithms. ARIMA is good for classic models combining autoregressive and moving average components; deep learning (RNNs and LSTMs) is good for complex patterns; exponential smoothing is good for capturing seasonality.
- Model Training involves splitting the data into training and validation sets and then training the model using historical data. It optimizes the model parameters.
- Feature Engineering involves selecting relevant features from the data and creating informative input variables. It extracts relevant features like lags – past observations as features; rolling statistics – moving averages, volatility; and calendar features – day of the week, holidays.
- Forecasting involves using the trained model to predict future values and evaluate forecast accuracy using metrics like root mean square error (RMSE).
- Cross-validation involves assessing model performance using validation techniques and ensuring robustness across different time intervals.
- Evaluation involves measuring model accuracy using error metrics and fine-tuning as needed for better results.
This workflow combines data preparation, modelling, and validation to create reliable time series forecasts.
Common Pitfalls and Best Practices in Machine Learning for Time Series
- Overfitting: Avoid overly complex models that fit noise. Also, regularize and validate rigorously.
- Ignoring Seasonality: Explicitly incorporate seasonal components. Also, utilize seasonal decomposition techniques like Seasonal-Trend decomposition using Regression (STR) and classical decomposition.
- Not Handling Non-Stationarity: Apply differencing or detrending to achieve data stationarity. ARIMA elegantly handles this.
Example of How to Predict the Lifespan of Vehicle Batteries Using the Azure AutoML Studio
In the following activities, we will explore a practical application of AutoML for time-series forecasting. Specifically, I’ll show you how to use AutoML to predict the lifespan of vehicle batteries. Azure’s AML studio simplifies the process, allowing us to train a simple linear regression model effortlessly.
An Azure subscription is required to carry out the activities in this article. If you are a student, you can use your university or school email to sign up for a free Azure for Students account and start building on the Azure cloud with a free $100 Azure credit.
Activity: Creating a Model Using Automated Machine Learning
Step 1: Create an automated machine learning experiment using the Azure AI Studio
1. Open your web browser and go to ai.azure.com to open the new Azure AI Studio (figure 1).

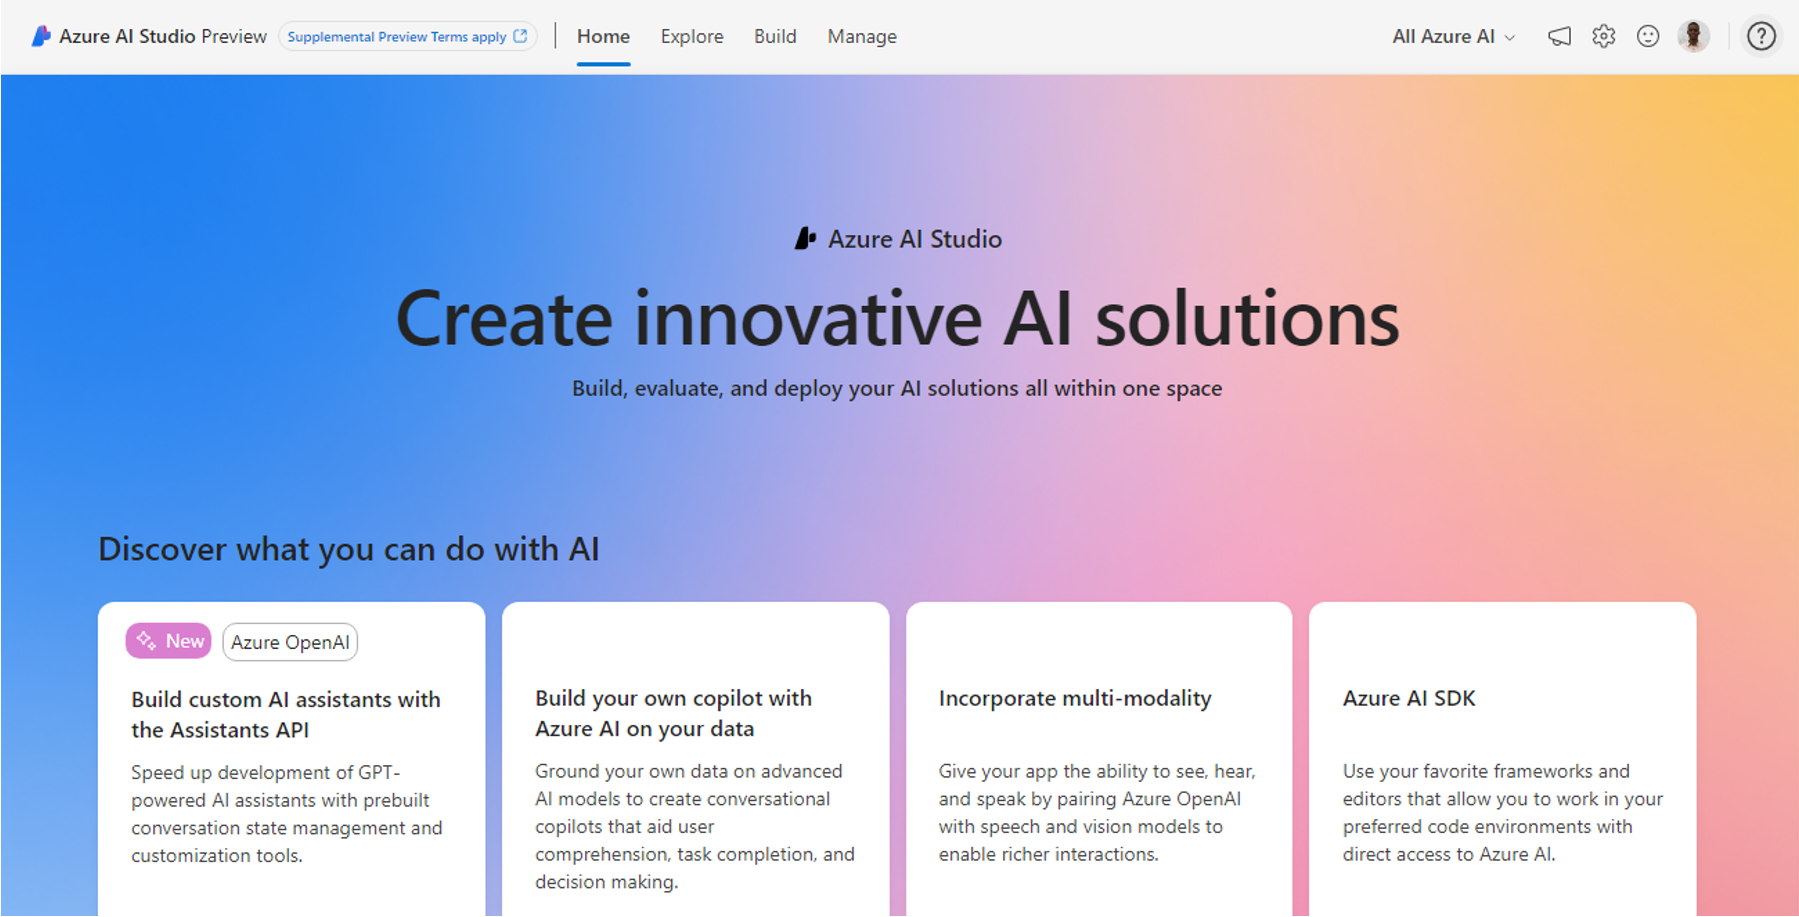
2. Go to Build on the Azure AI Studio top menu and click on it to open the Build environment. Then click on the + New project button (figure 2) to open the Create a project environment.

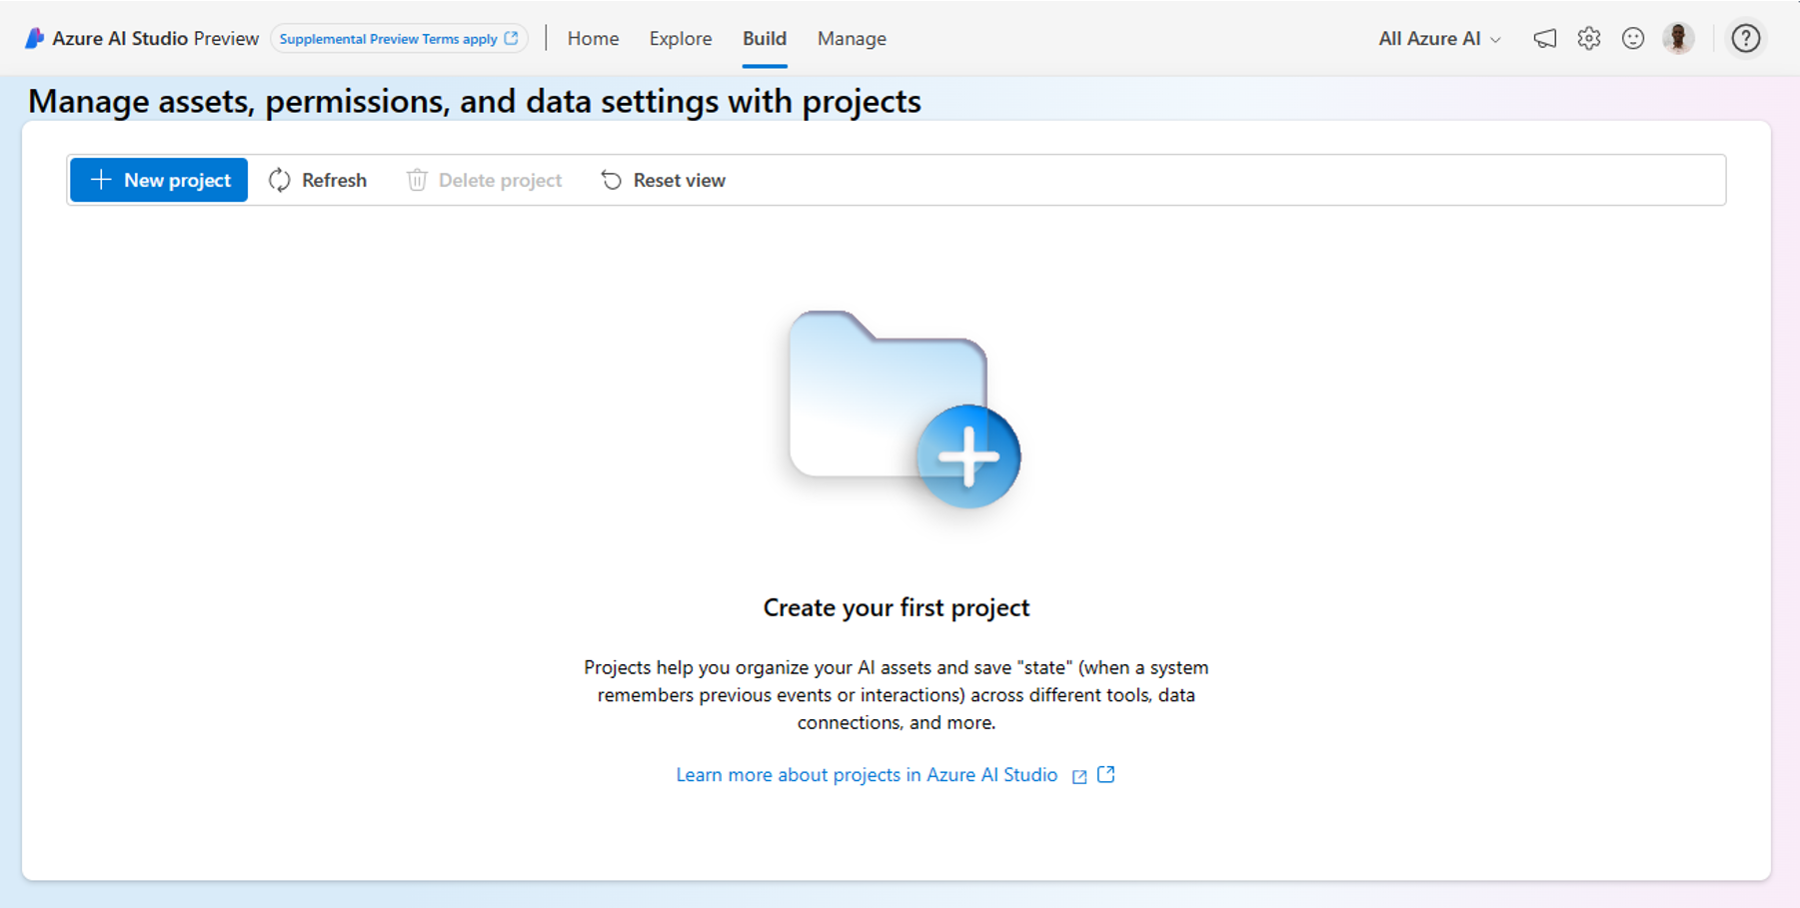
Step 2: Creating your project
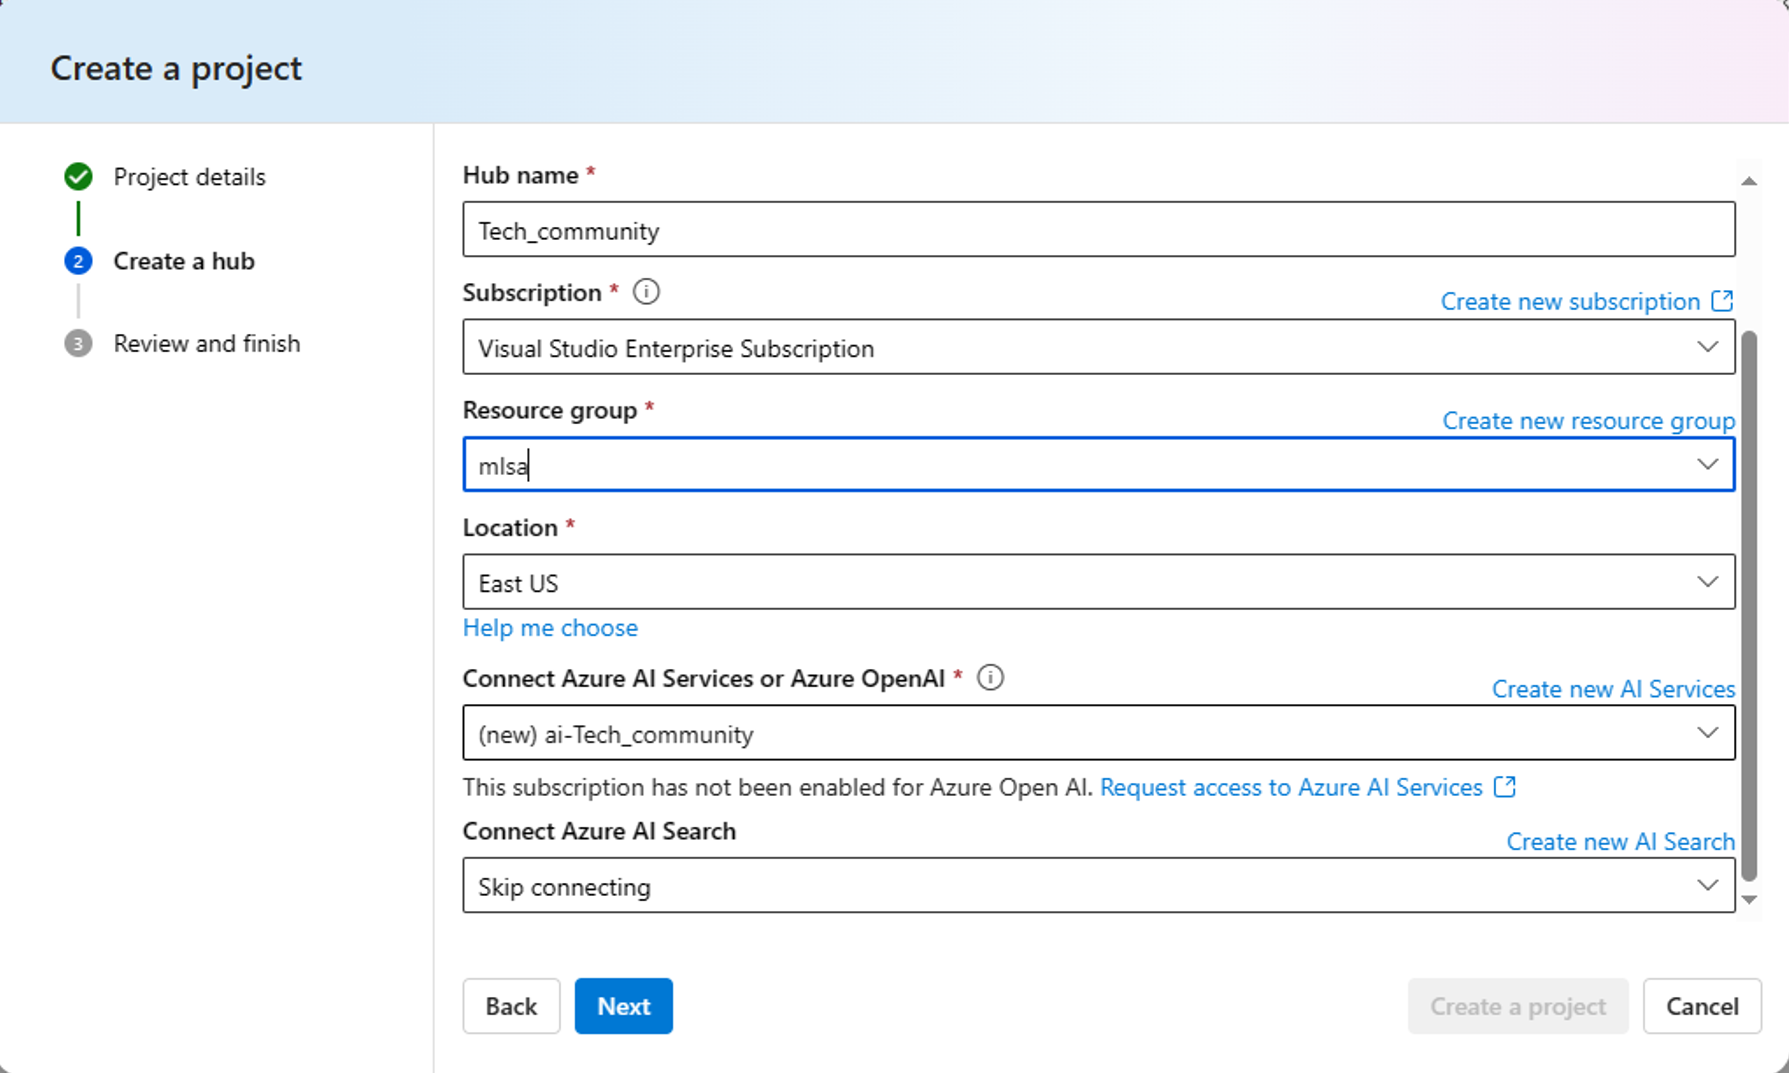
1. For the Project details section (figure 3):
- At Hub name, key in your preferred name for your project’s hub in the input box provided.
- At Subscription, select your existing subscription from the drop-down menu.
- Select your Resource group. If you have any existing resource group, select it from the drop-down menu. Otherwise, click on Create new to create a new resource group, and click OK after that.
- At Location, select your location from the drop-down menu. Then, click on the Next button at the bottom of the screen to go to the Review and finish.

2. At the Review and finish section, click on Create a project button at the bottom of the screen to provision your workspace on Azure AI Studio. The new project is shown in figure 4.

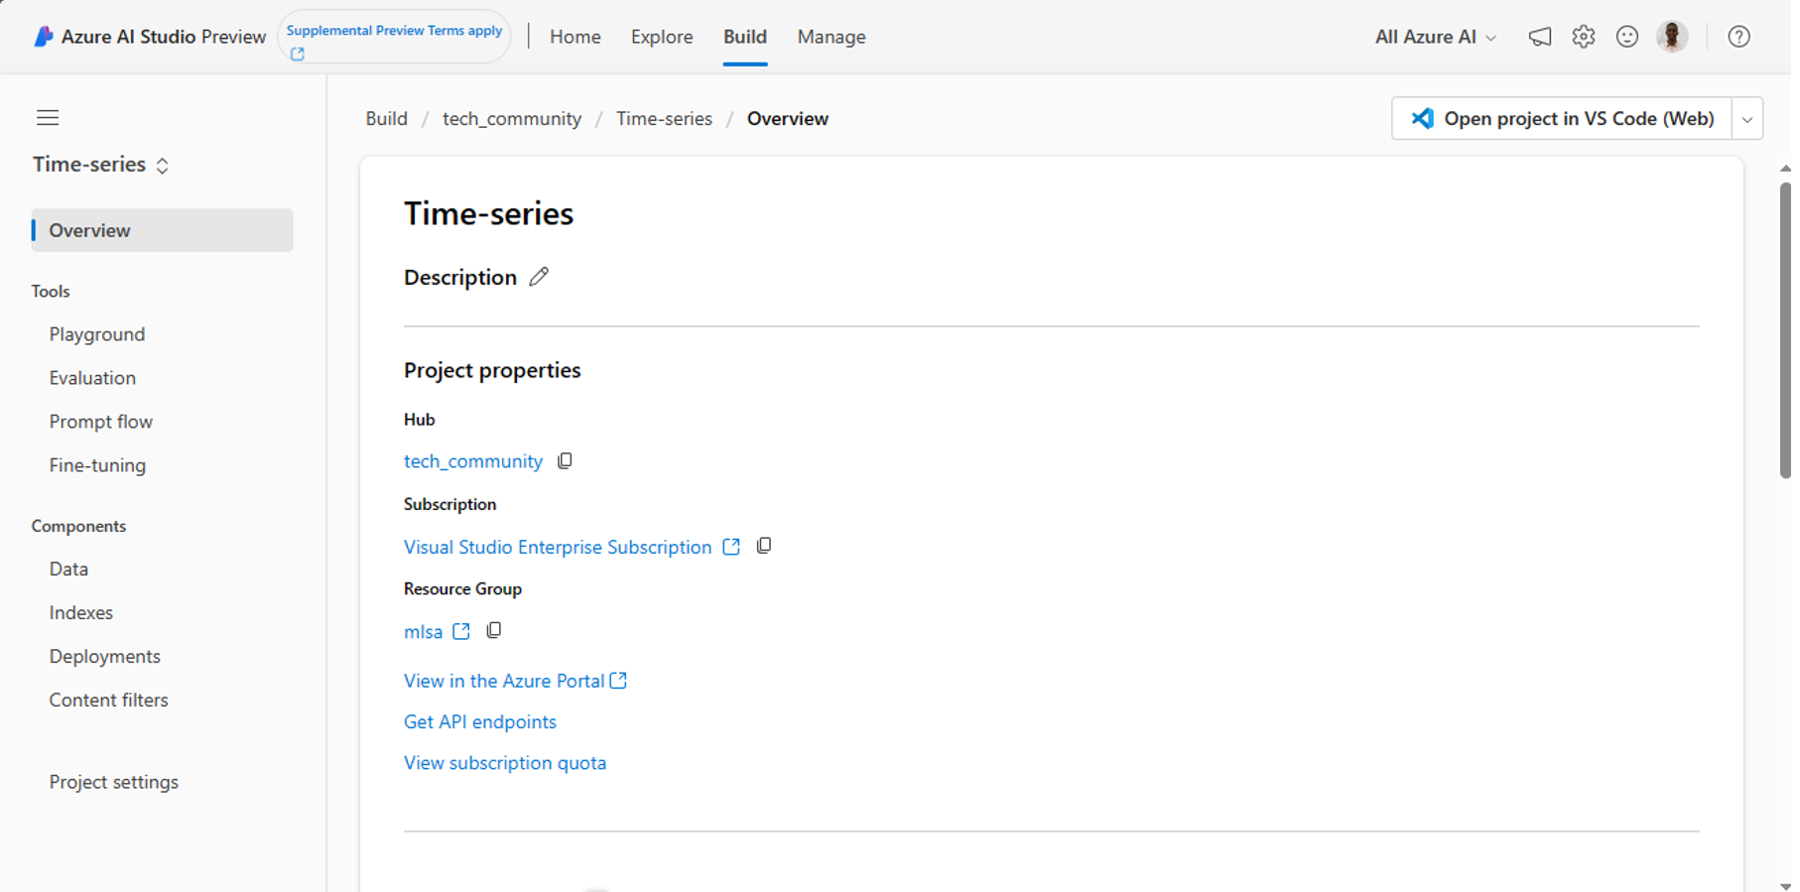
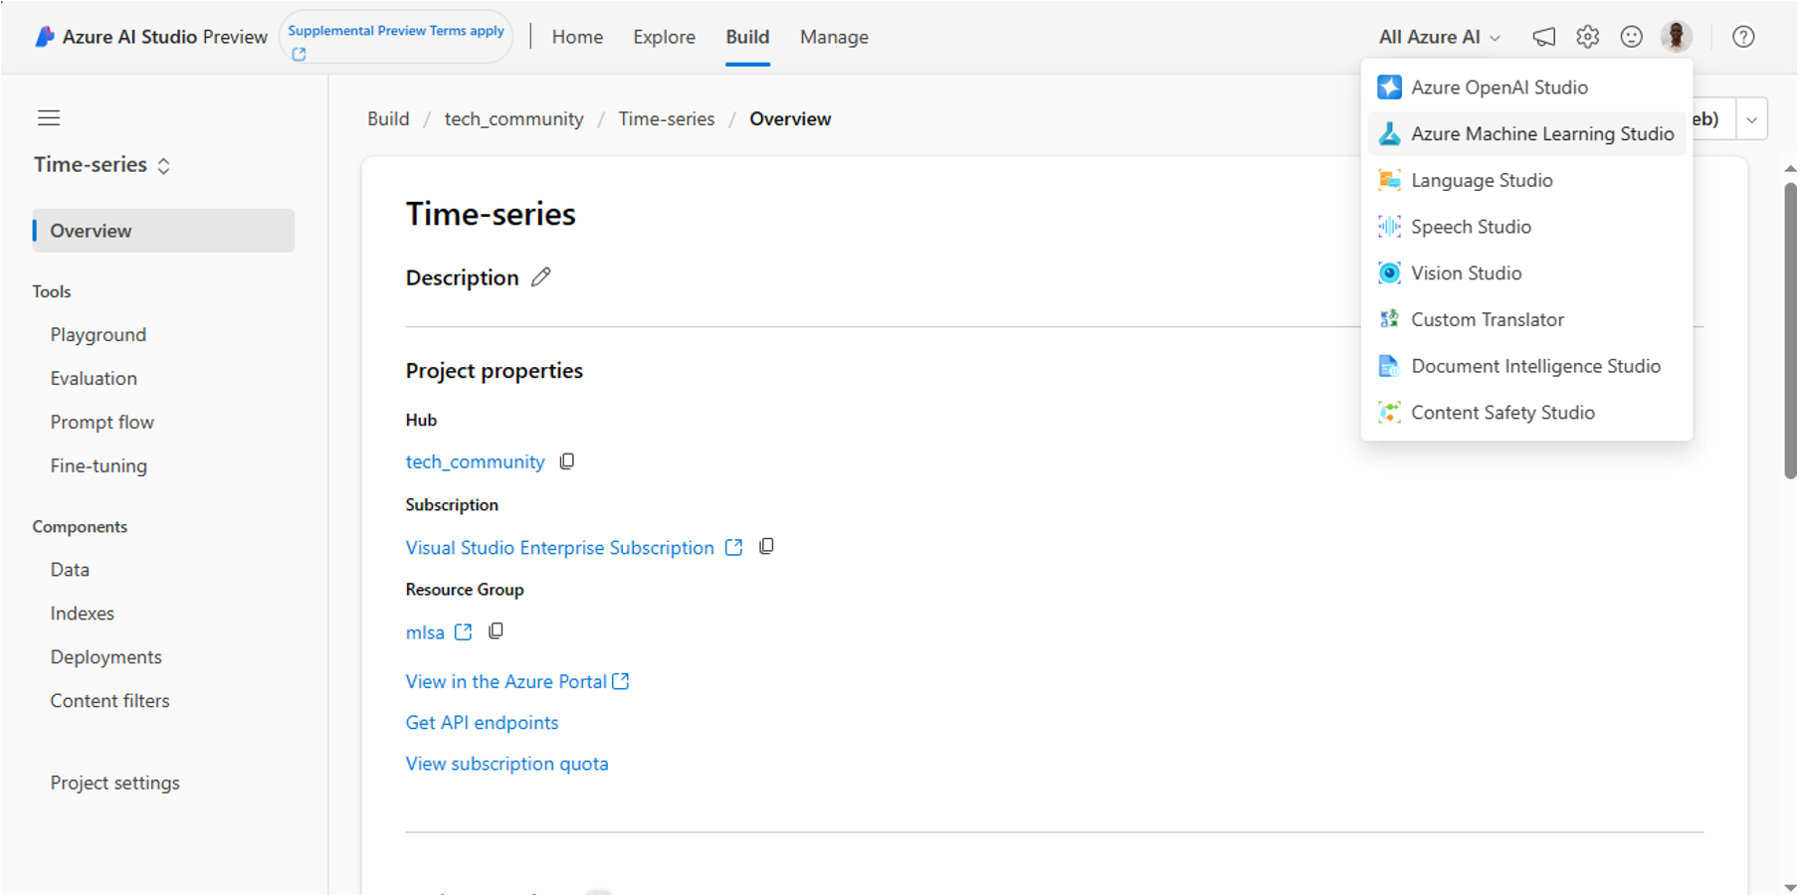
3. Your provisioned workspace will display the window below. Go to the All Azure AI at the upper right of the screen and select the Azure Machine Learning Studio from the drop-down menu, as shown in figure 5.

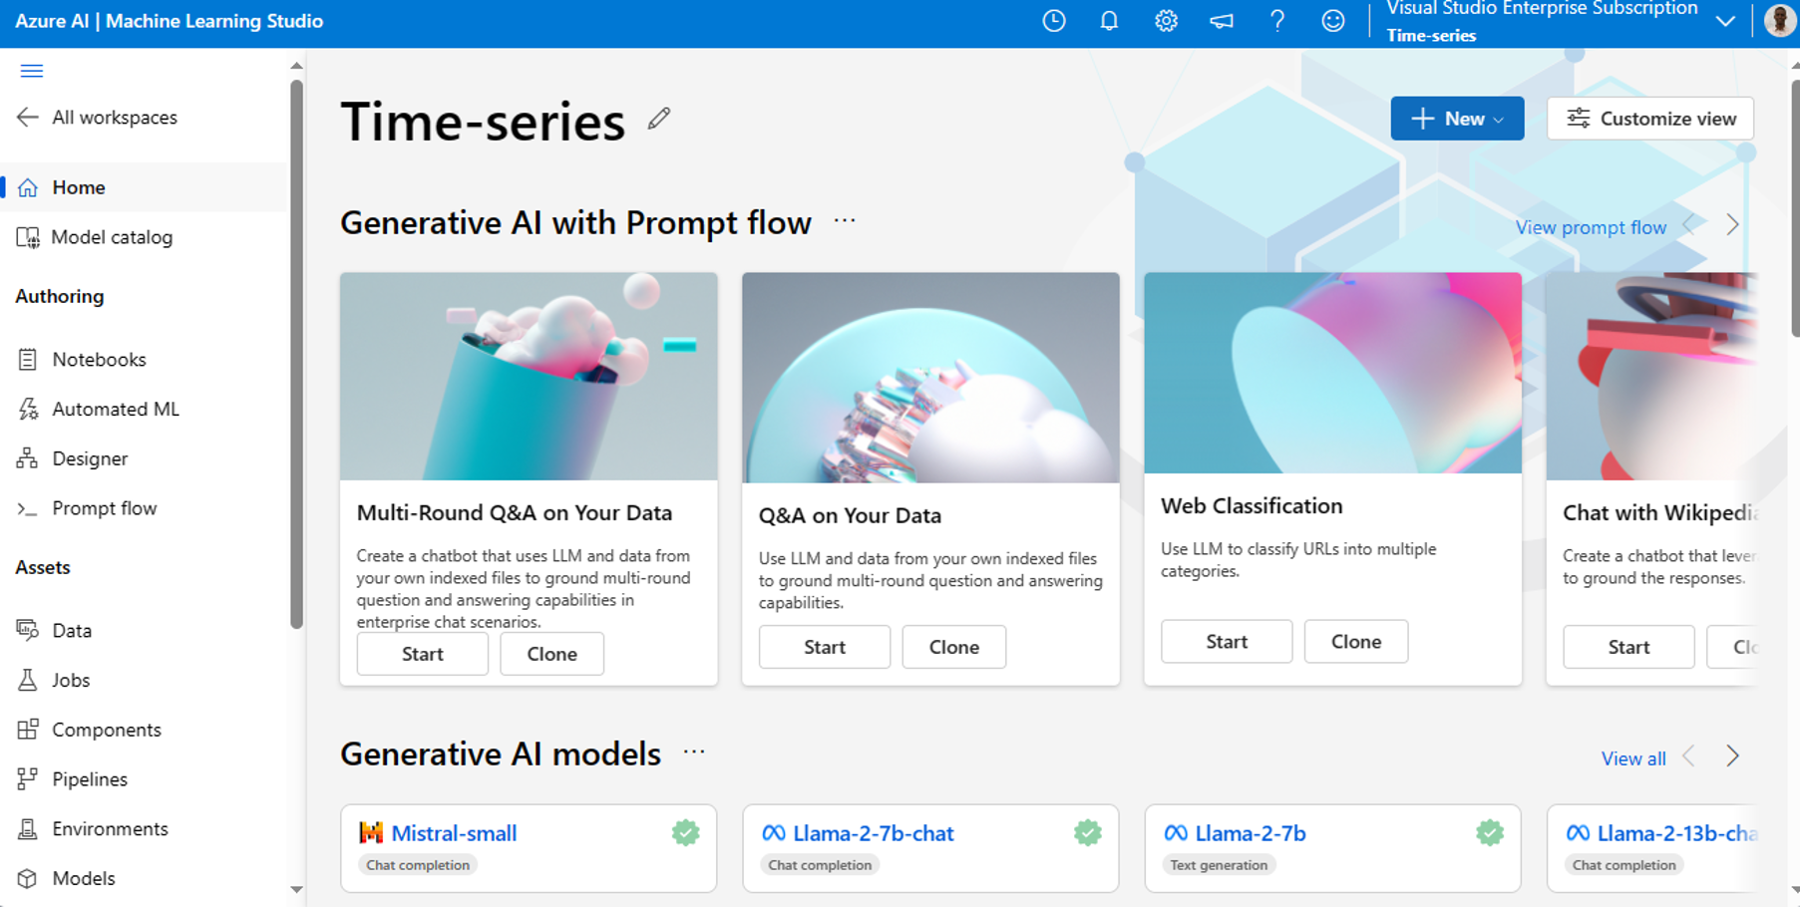
4. Under Authoring, select Automated ML in the left navigation bar. You’ll navigate to Azure AI Machine Learning Studio as shown in figure 6.

Step 3: Create an automated machine-learning experiment
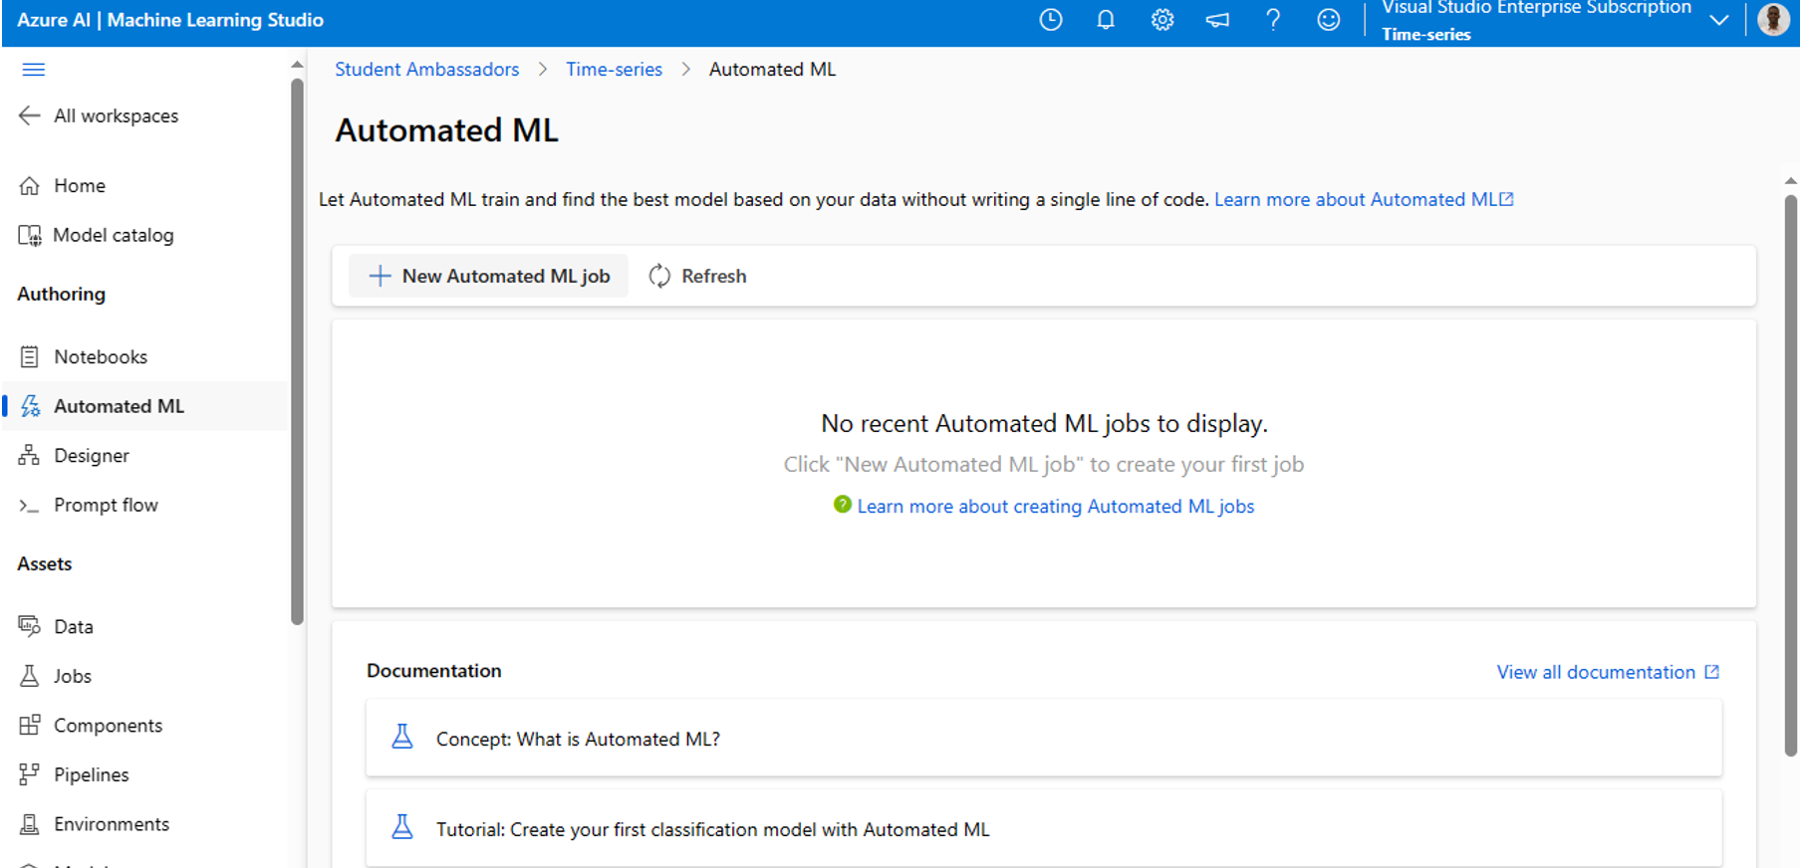
1. Click + New Automated ML job to start creating a new experiment (figure 7).

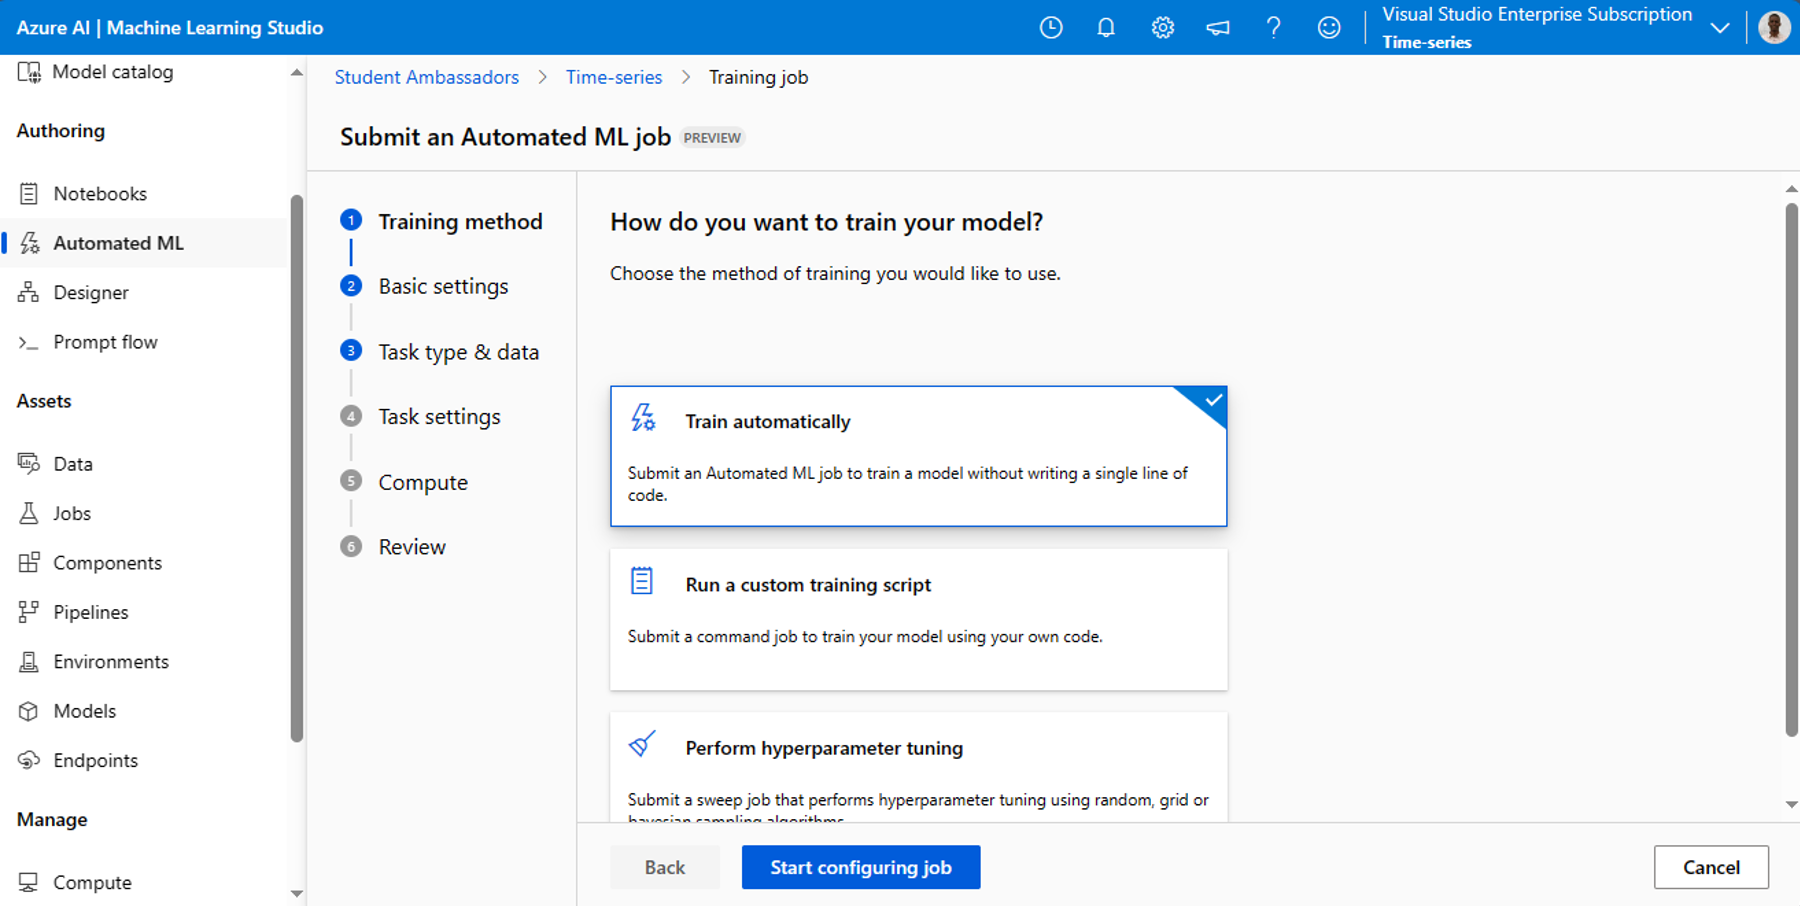
2. In the Training method section, select the Train automatically option and click the Start configuring job button at the bottom of the screen (figure 8).

3. In the Basic settings section (figure 9), key in the name of your job and your experiment name.

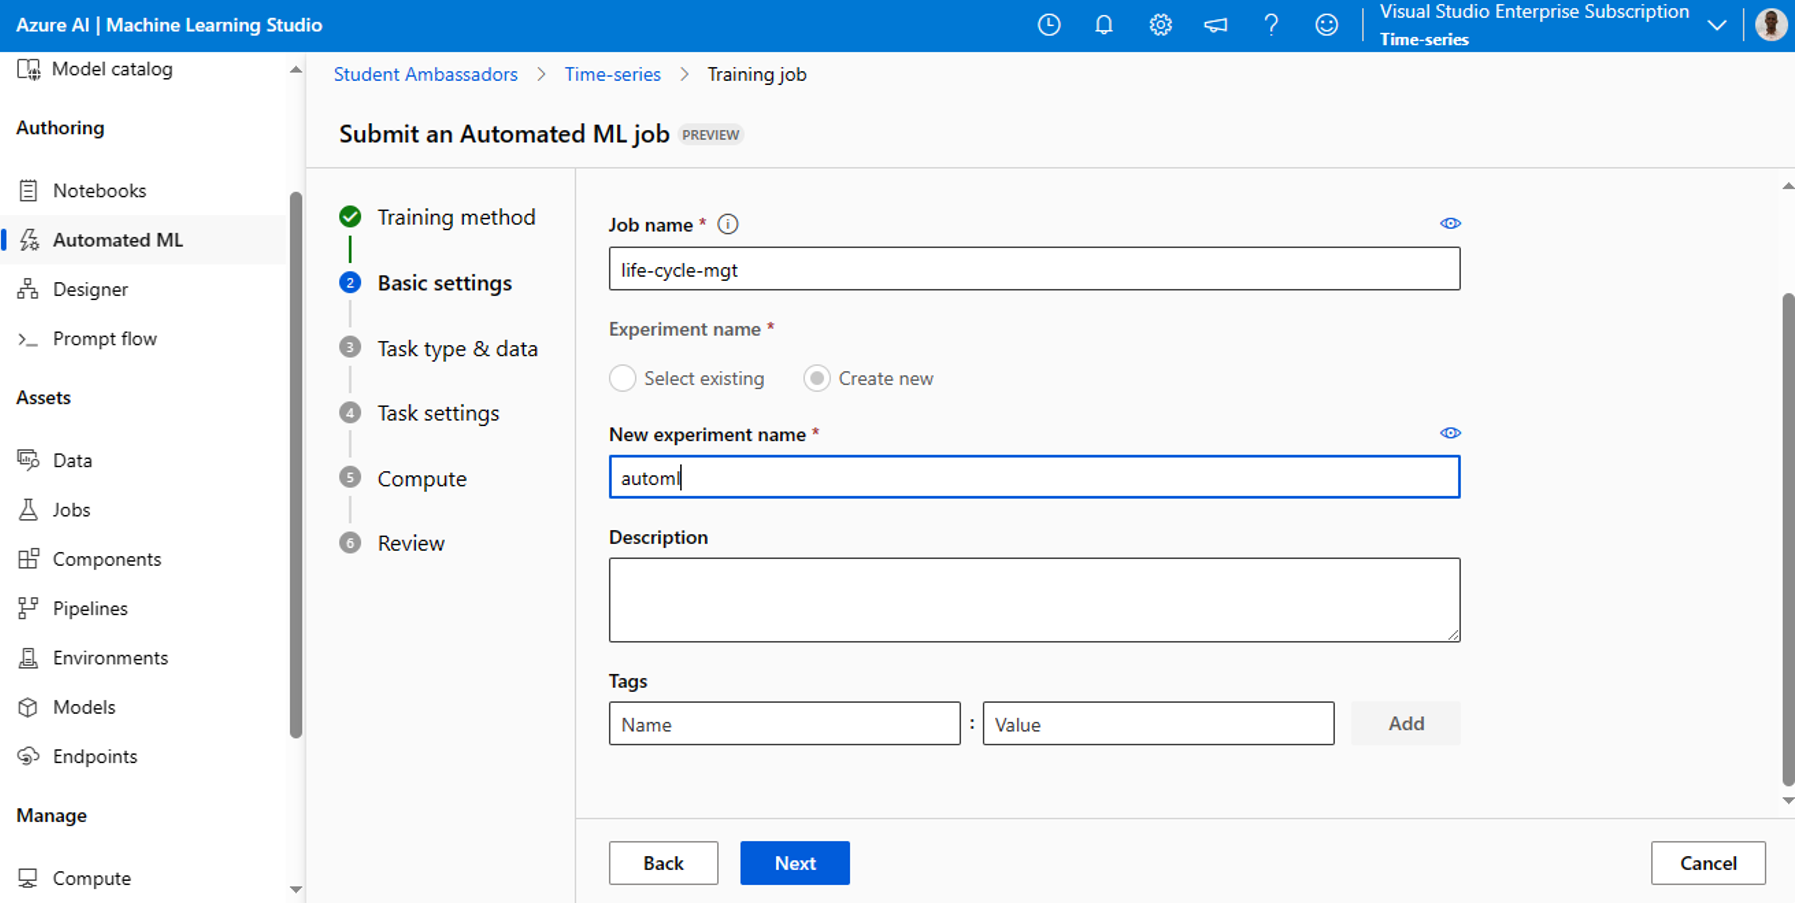
4. In the Task and & data section (figure 10), for the Select task type, select Regression from the drop-down menu. For the Select data section, click the +Create button.

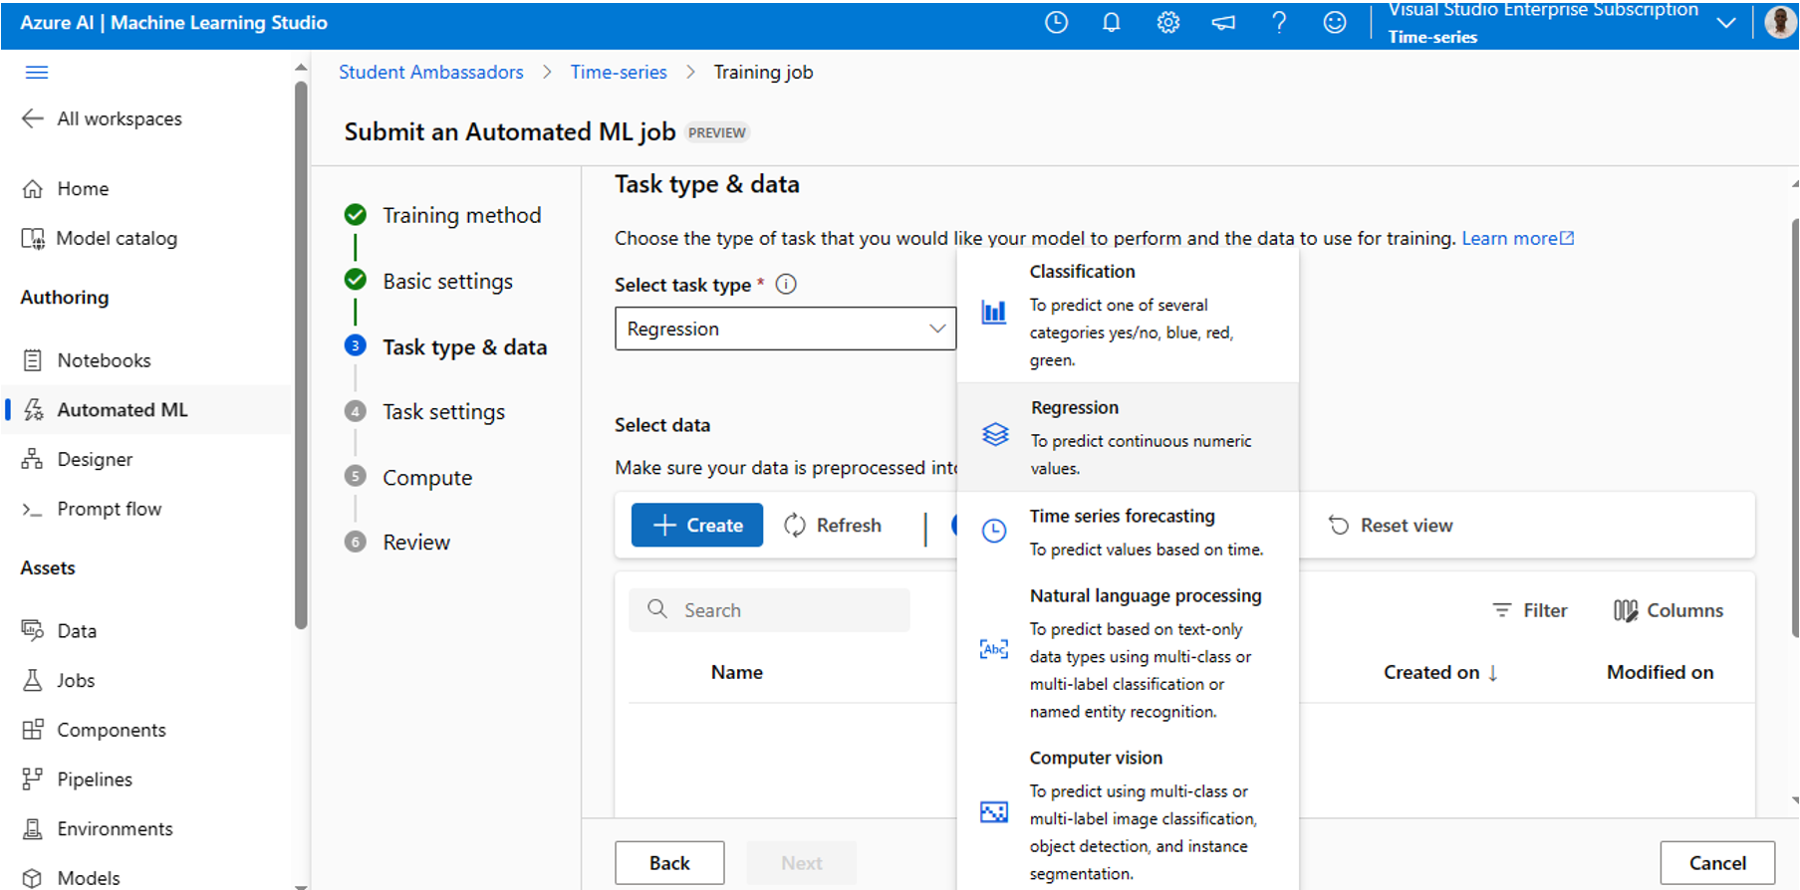
5. In the Create data asset environment (figure 11), set the name of your data asset to training-formatted-dataset, and the type to Tabular from the drop-down menu. Then click on Next.

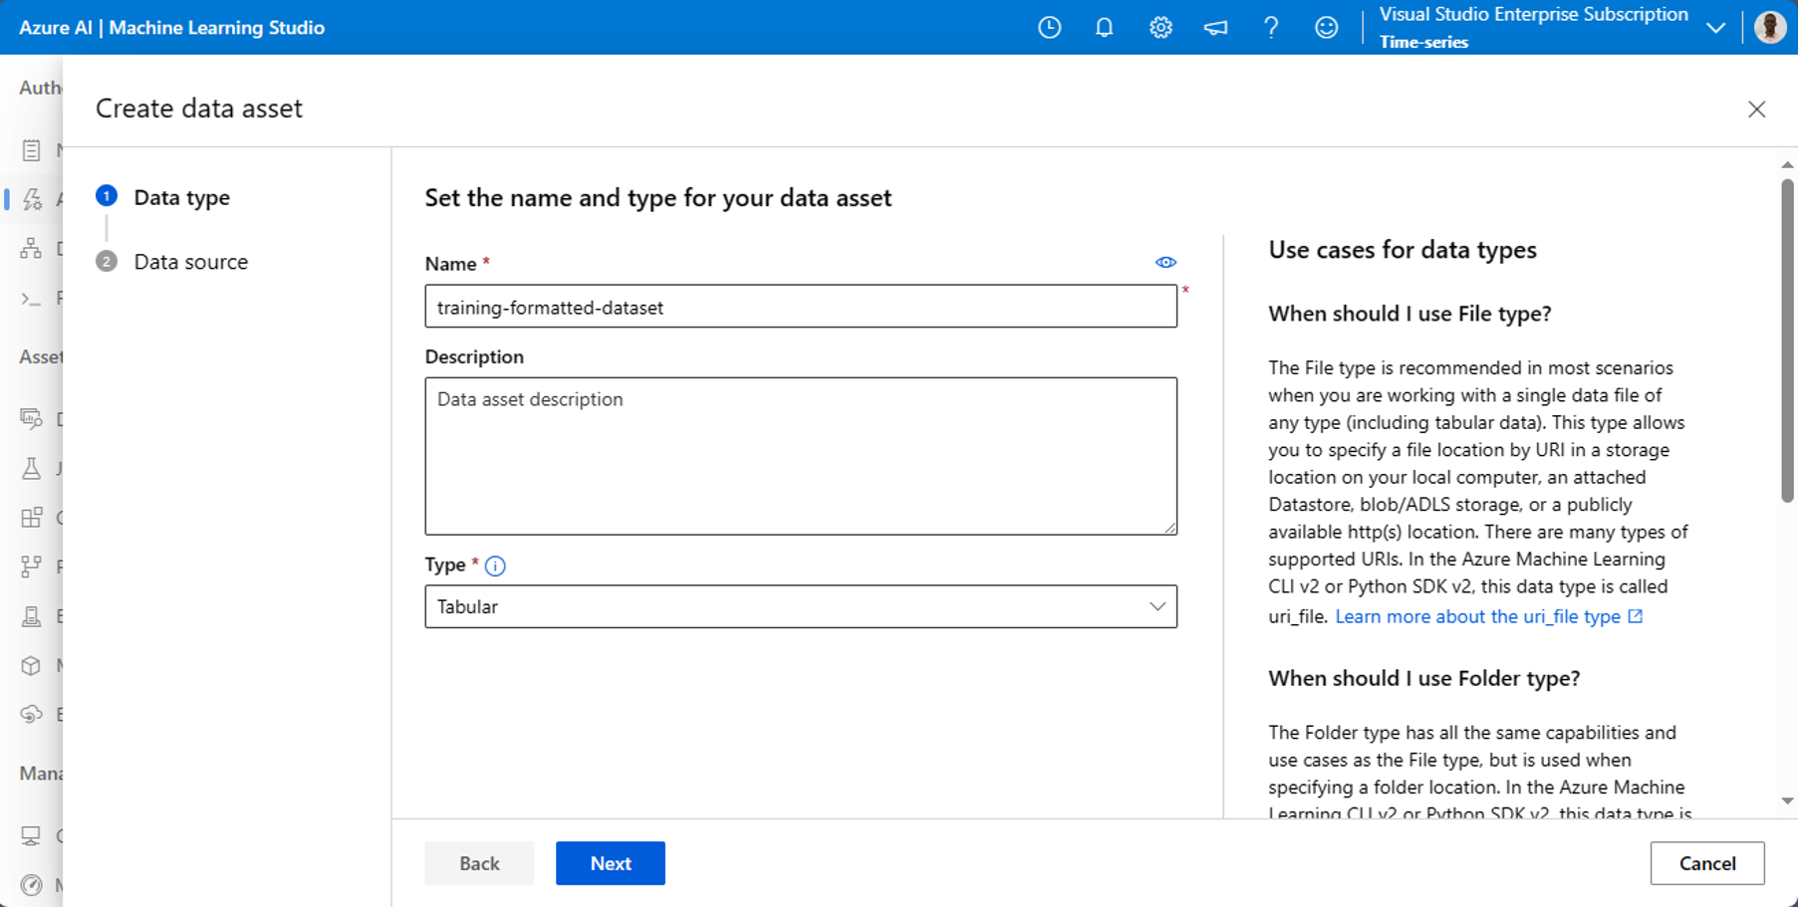
6. In the Data source section (figure 12), select From web files and click the Next button.

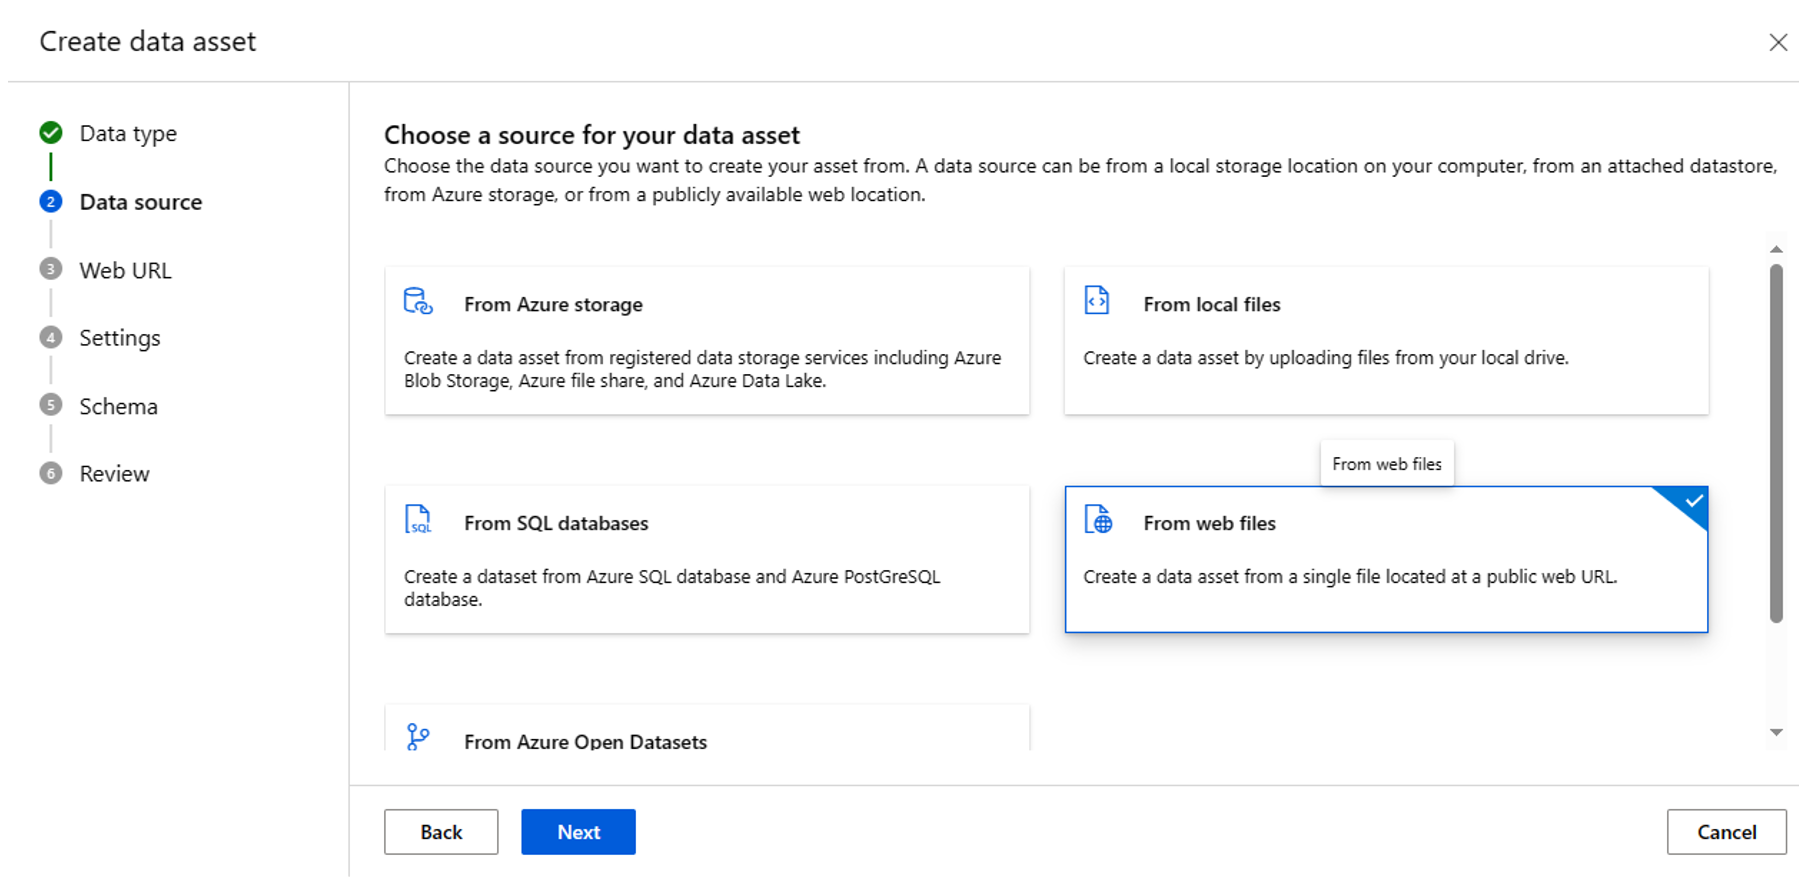
7. In the Web URL section (figure 13), enter this URL: https://introtomlsampledata.blob.core.windows.net/data/battery-lifetime/training-formatted.csv, and click the Next button.

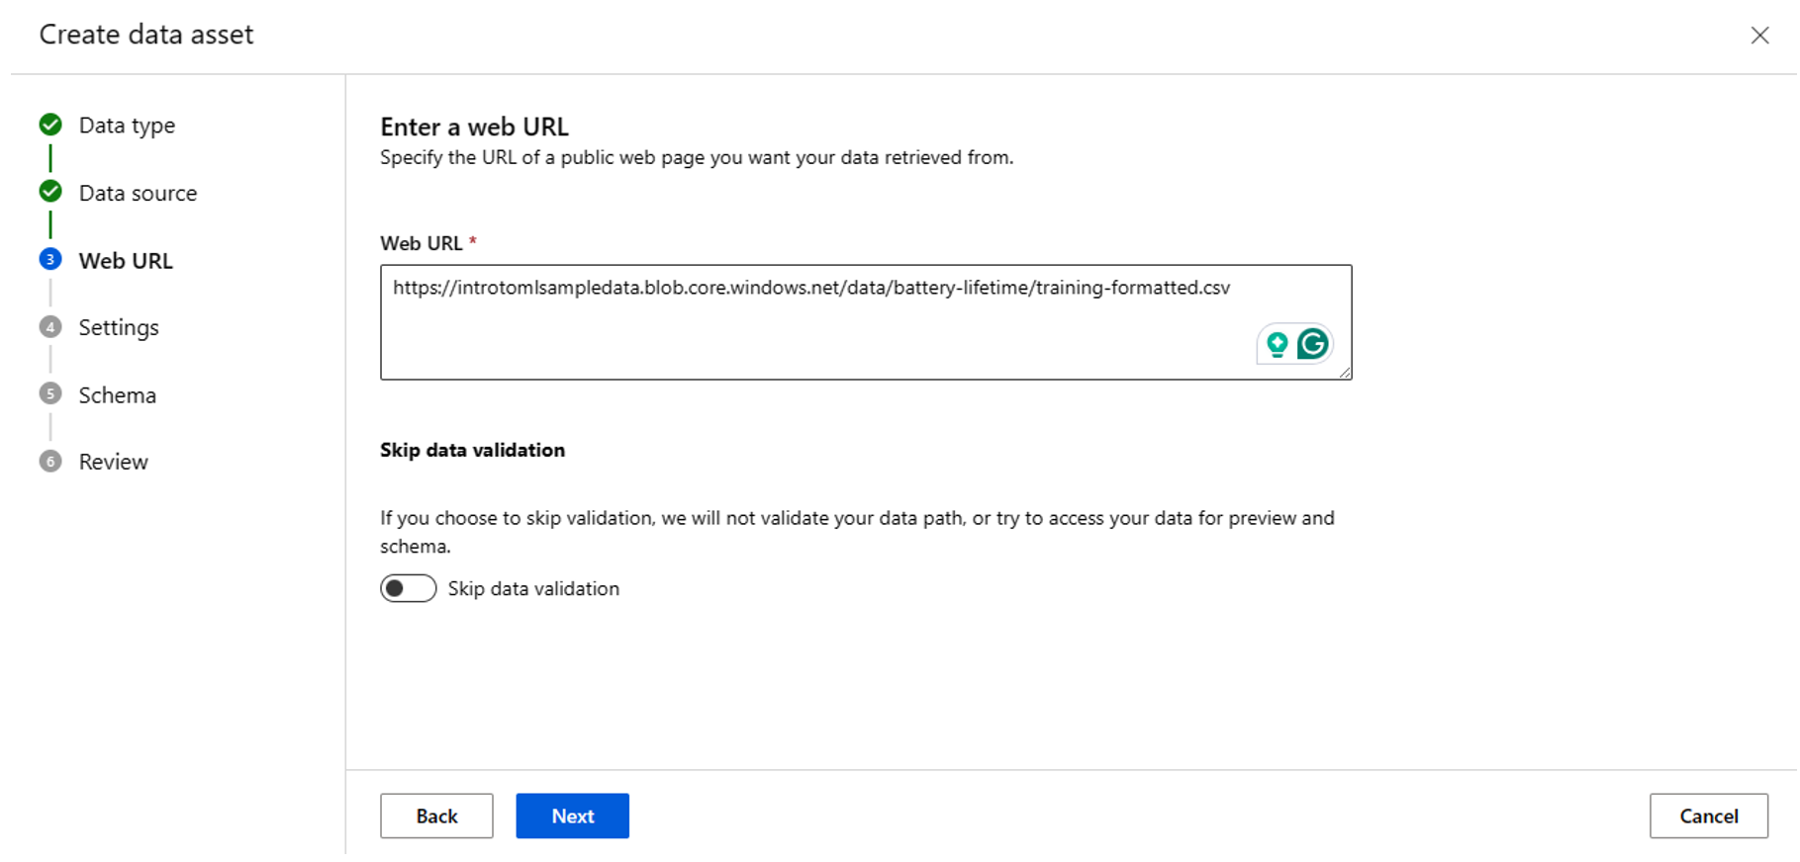
8. In the Settings section (figure 14), for the Column headers field, select All files have same headers. Scroll to the right to observe all of the columns in the data.

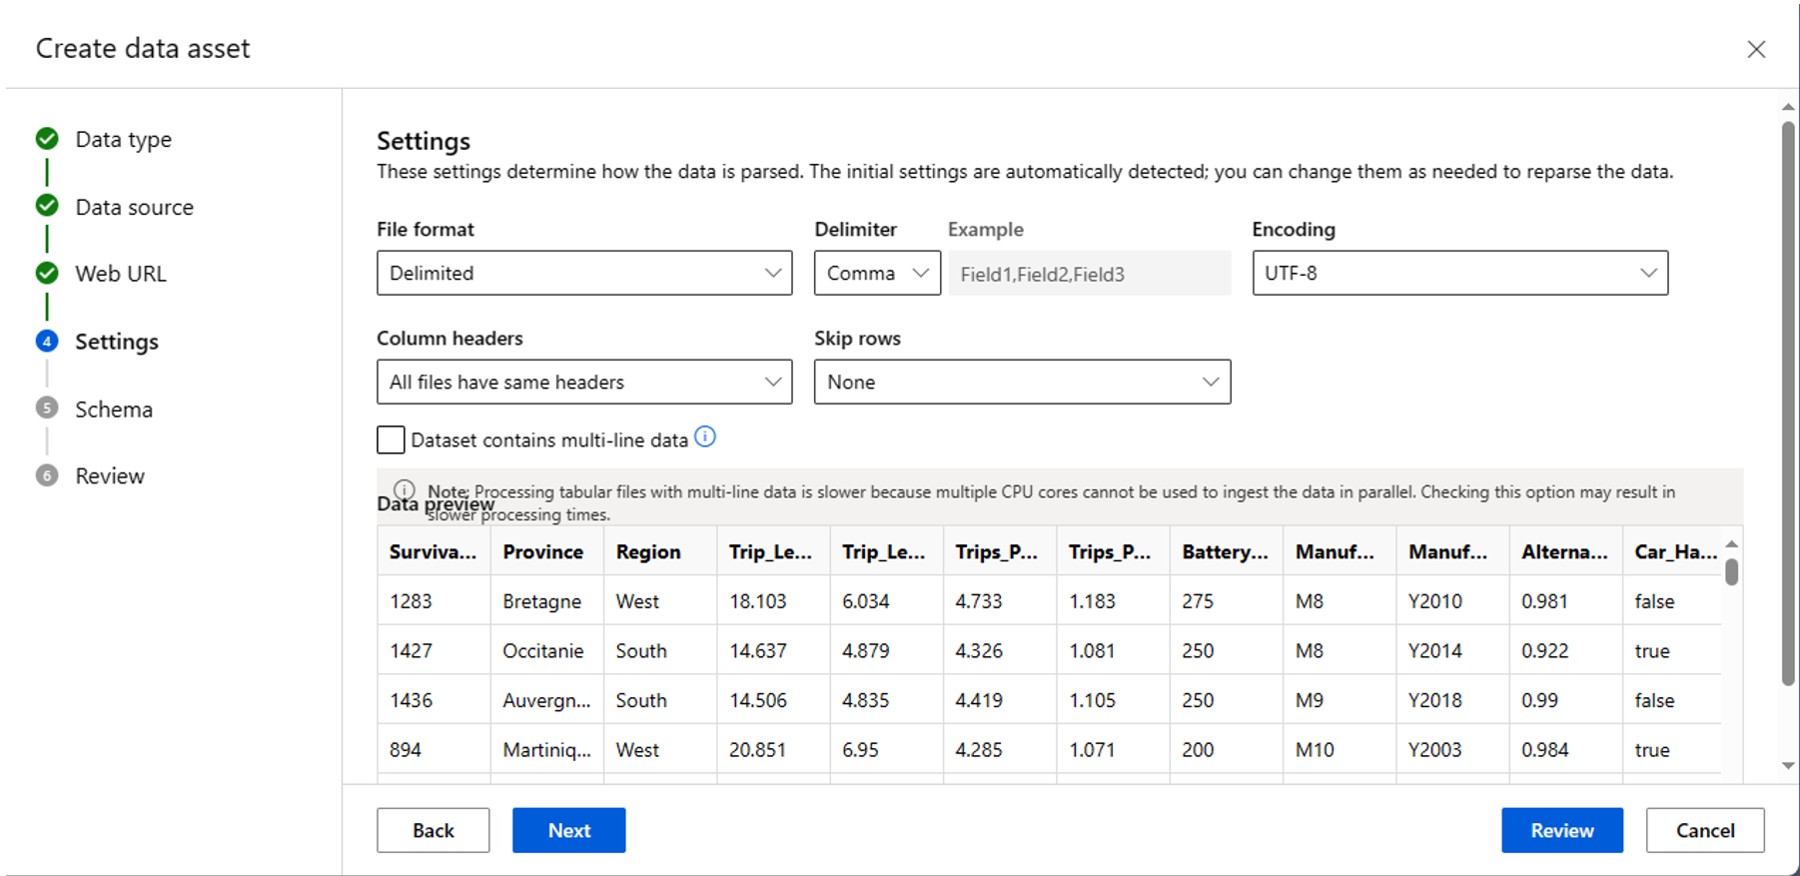
9. Select Next to check the schema and then confirm the dataset details by selecting Next (figure 15) and then Create on the Review page. The dataset is created.

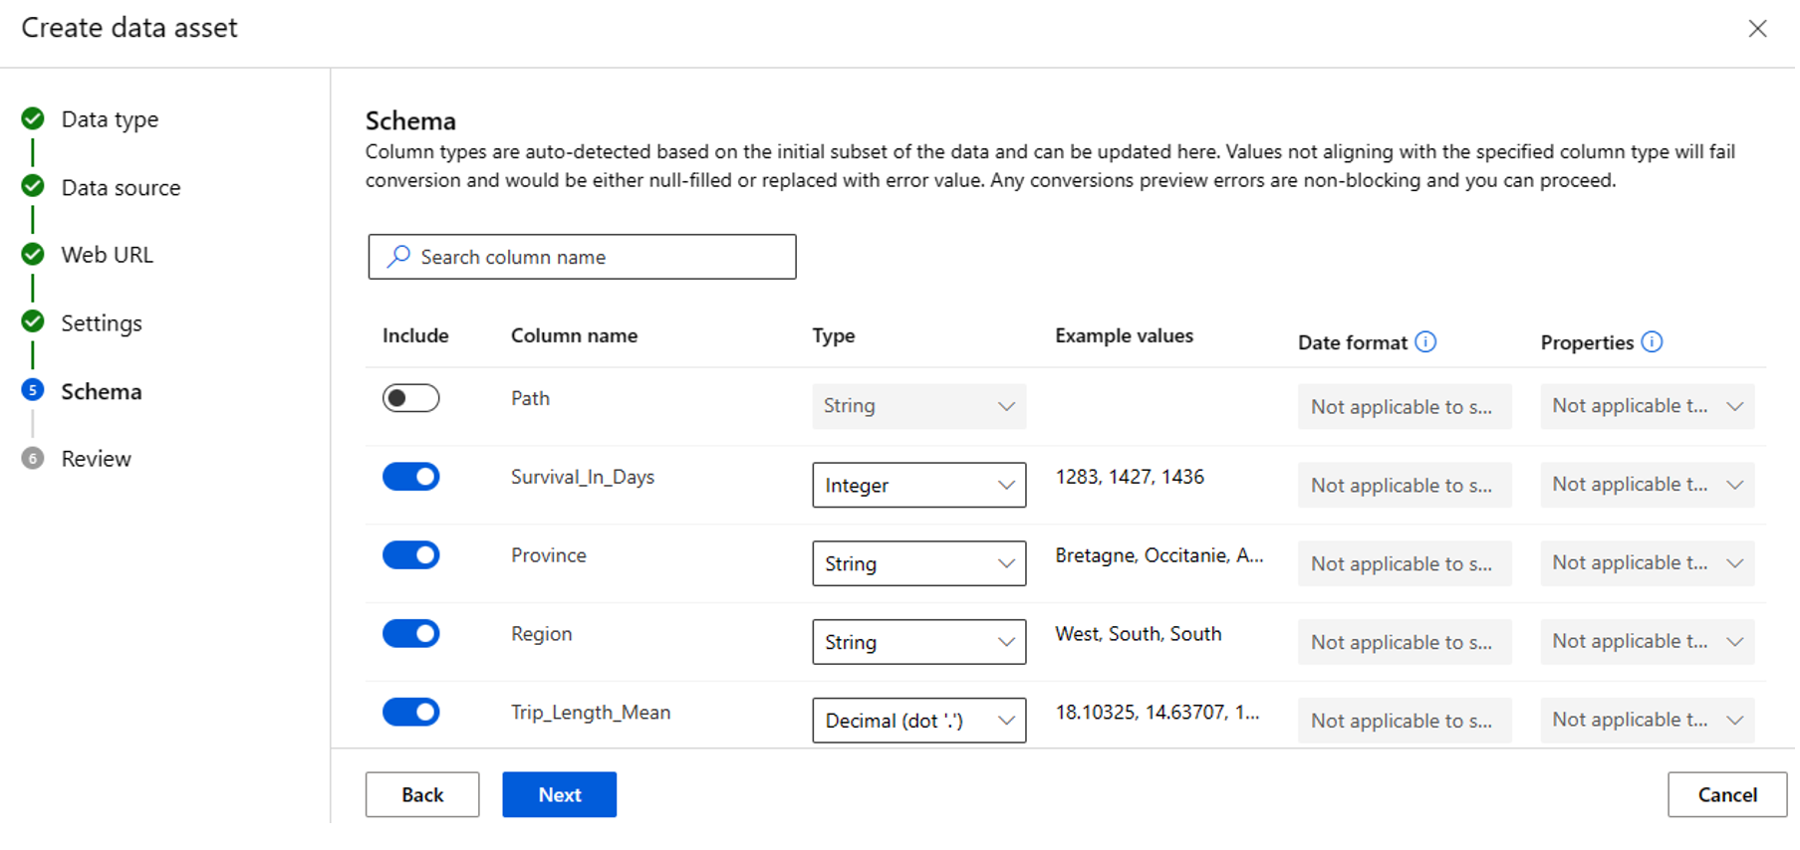
Step 4: Set up your compute target
1. Select the training-formatted-dataset dataset (figure 16) and select Next to move to the Task settings page.

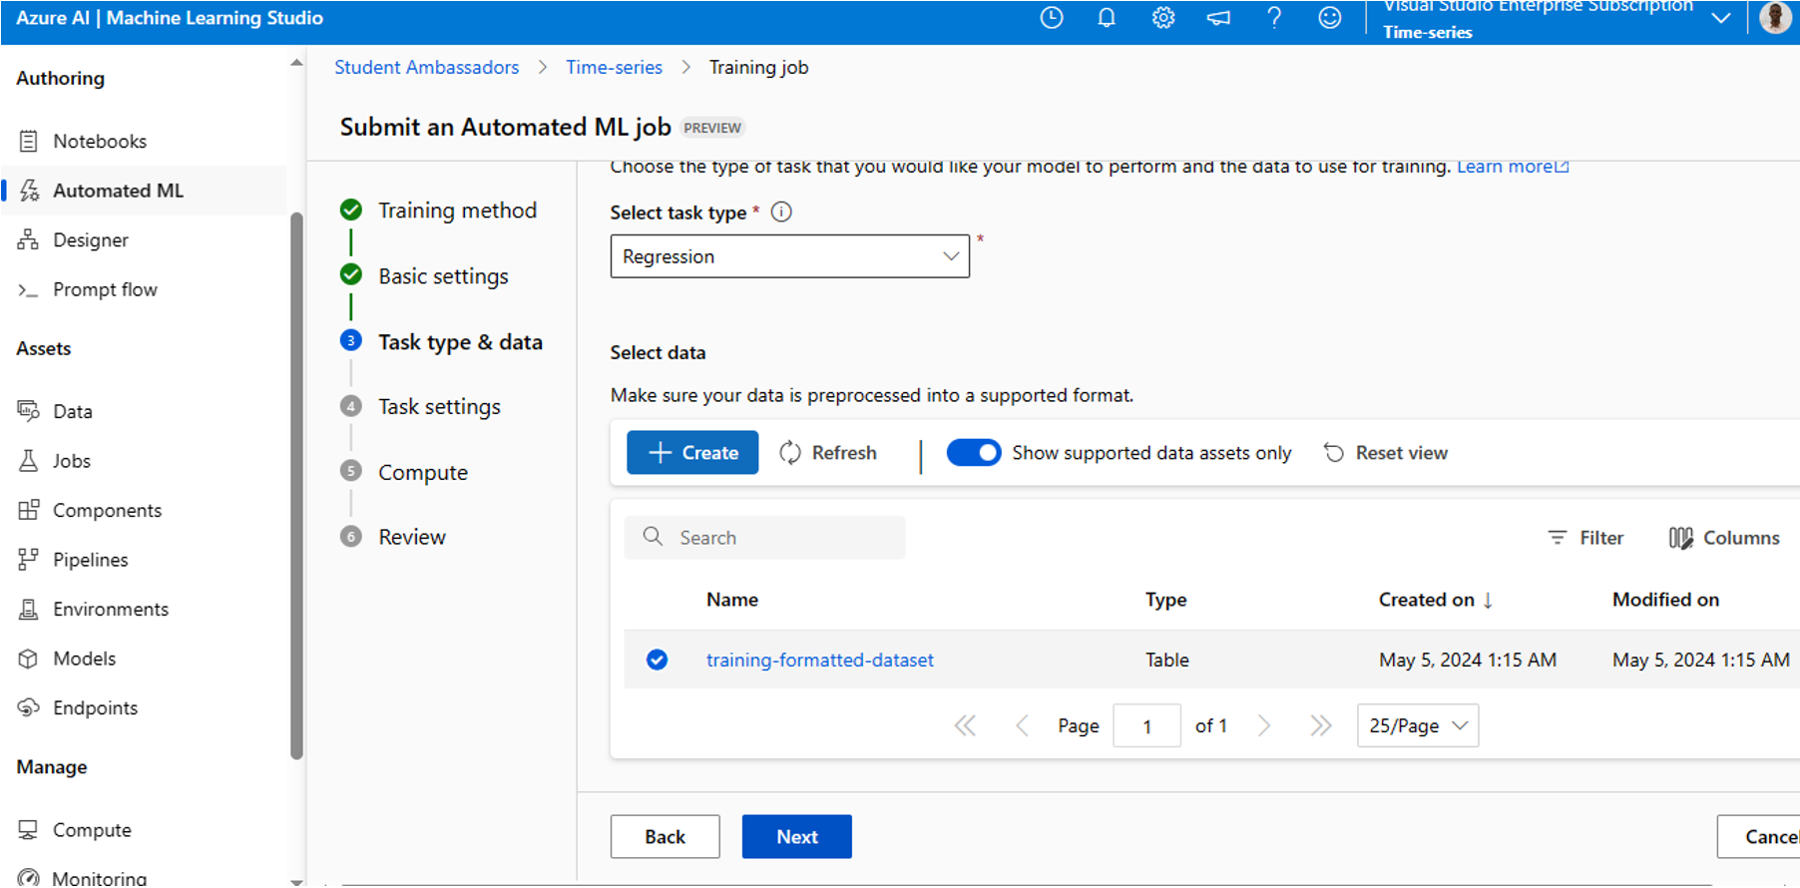
2. In the Task setting:
a. For the Target column: select Survival_In_Days (Integer) as shown in figure 17 and then click scroll down to set limits.

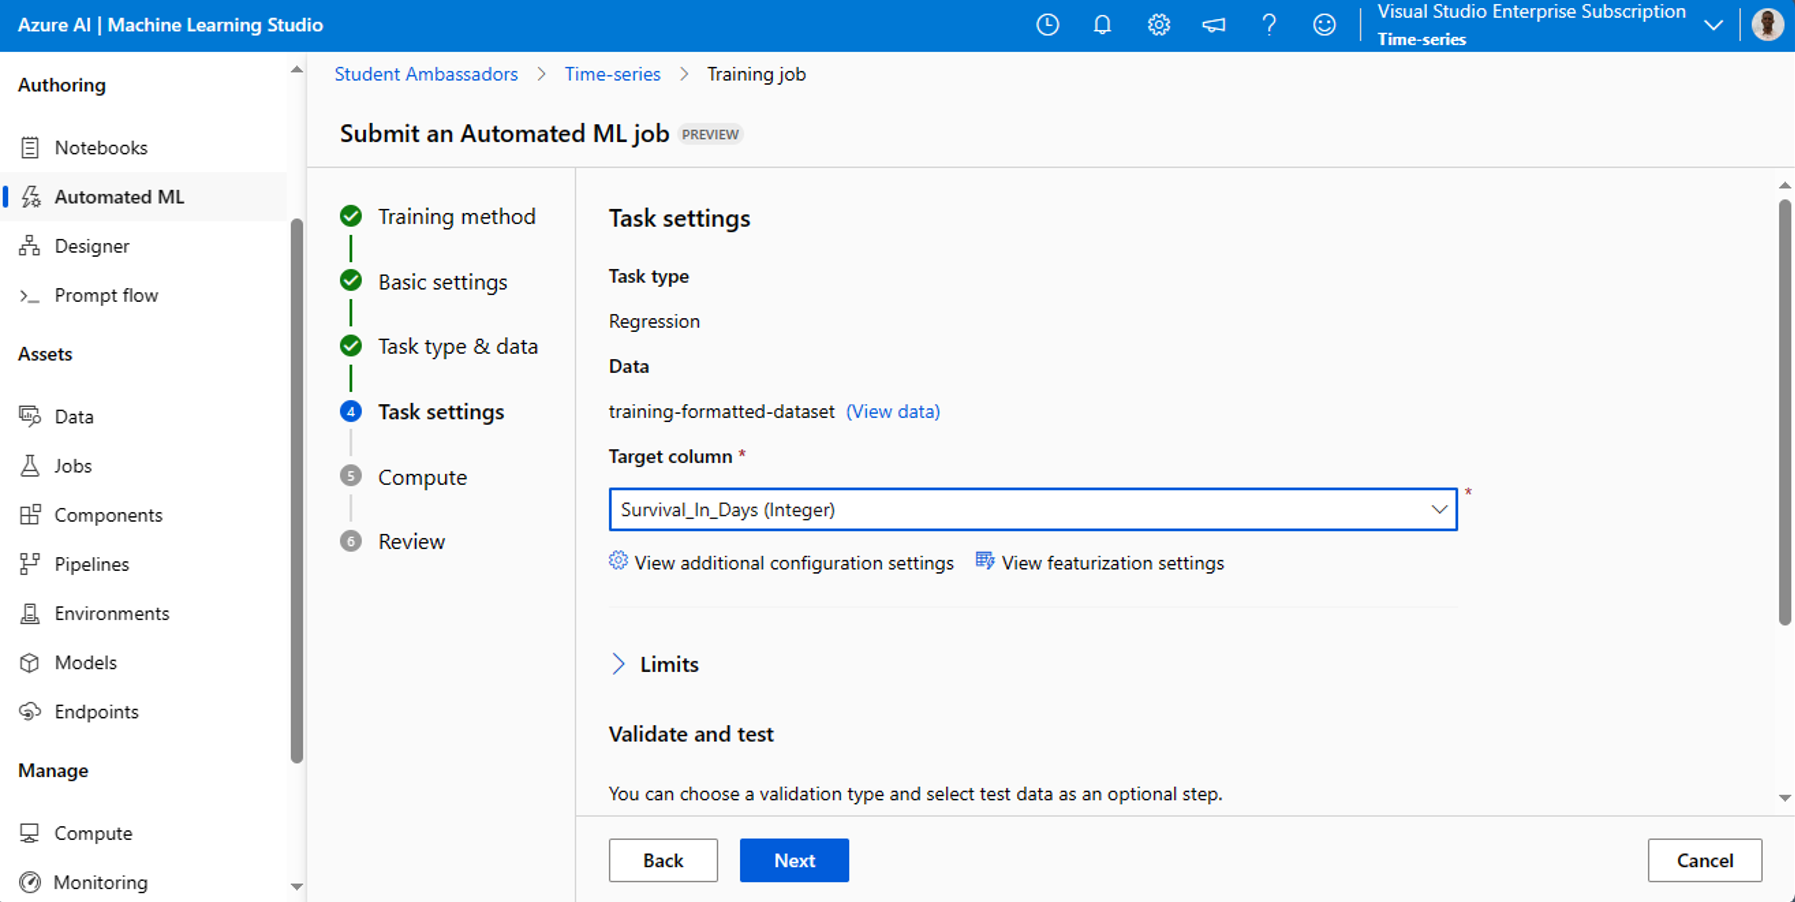
b. Set the Metric score threshold to 0.09 as shown in figure 18.

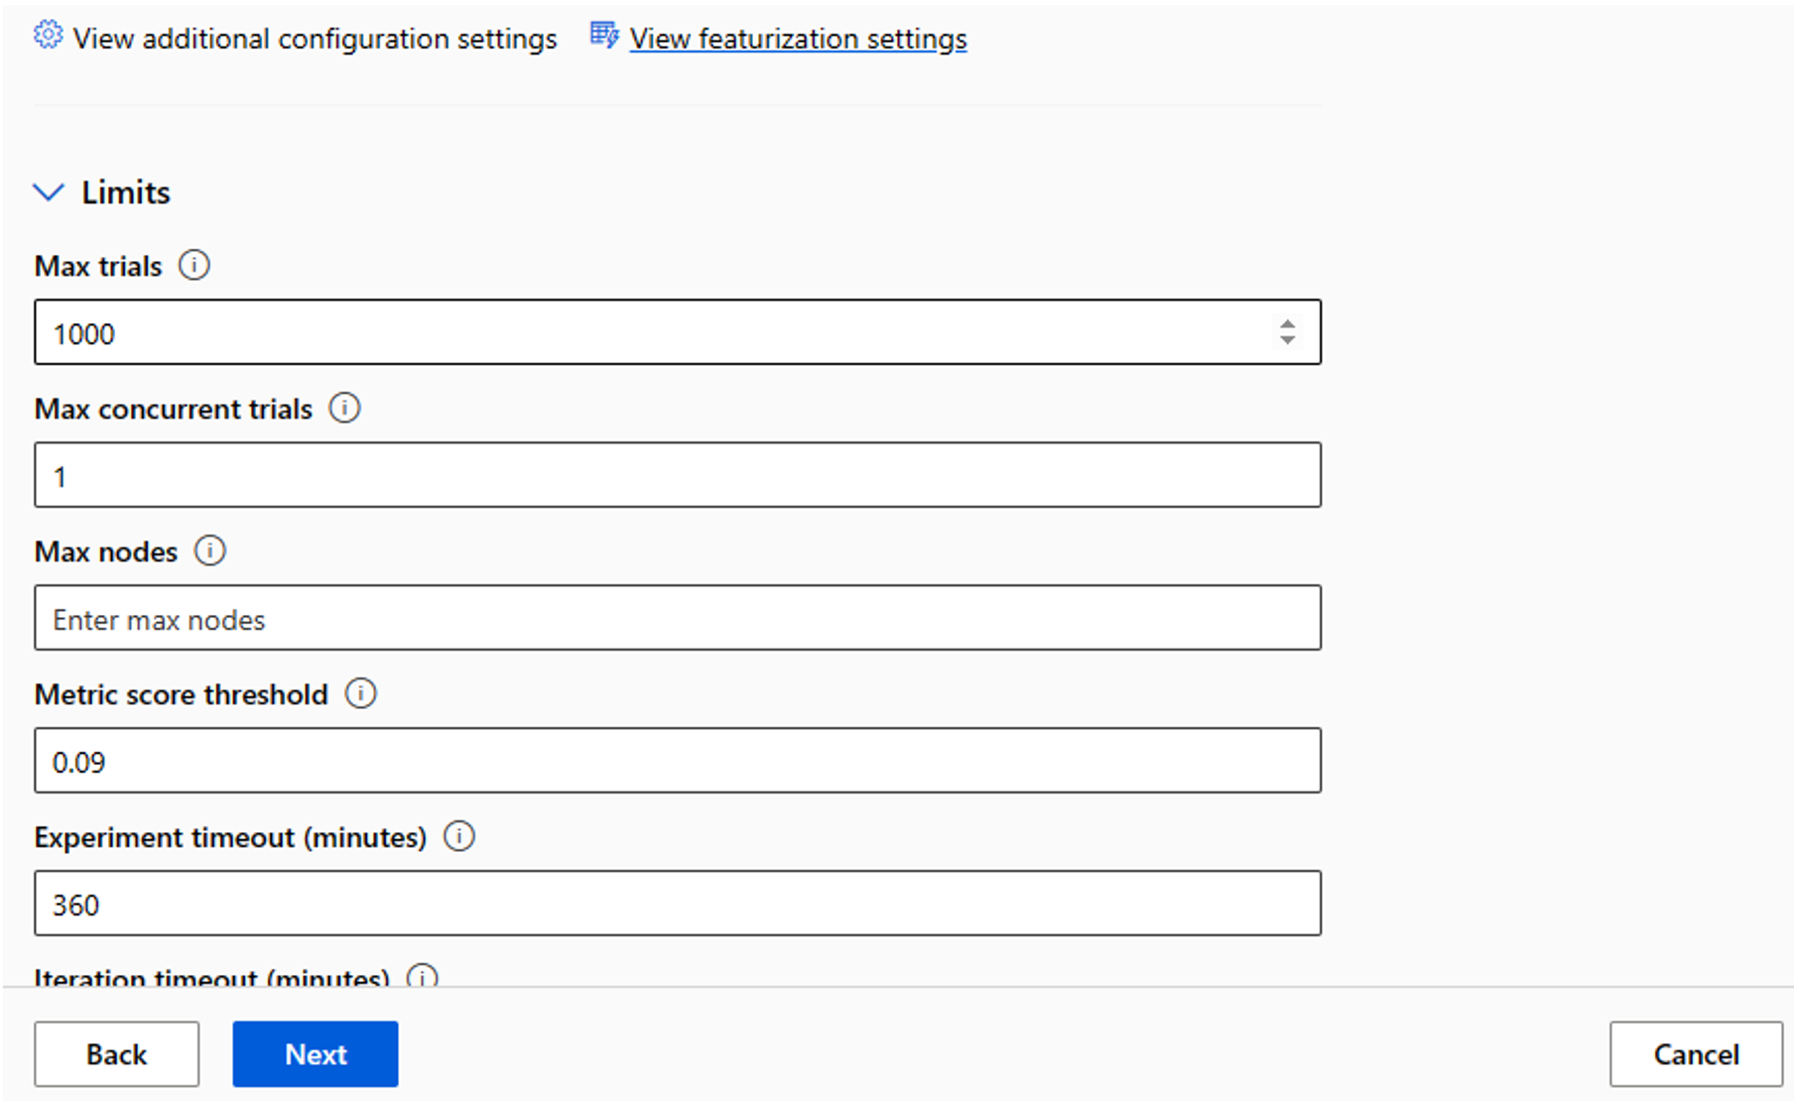
c. Set the Validation type to k-fold cross-validation from the drop-down menu and set the Number of cross-validation to 5. Then click the Next button.
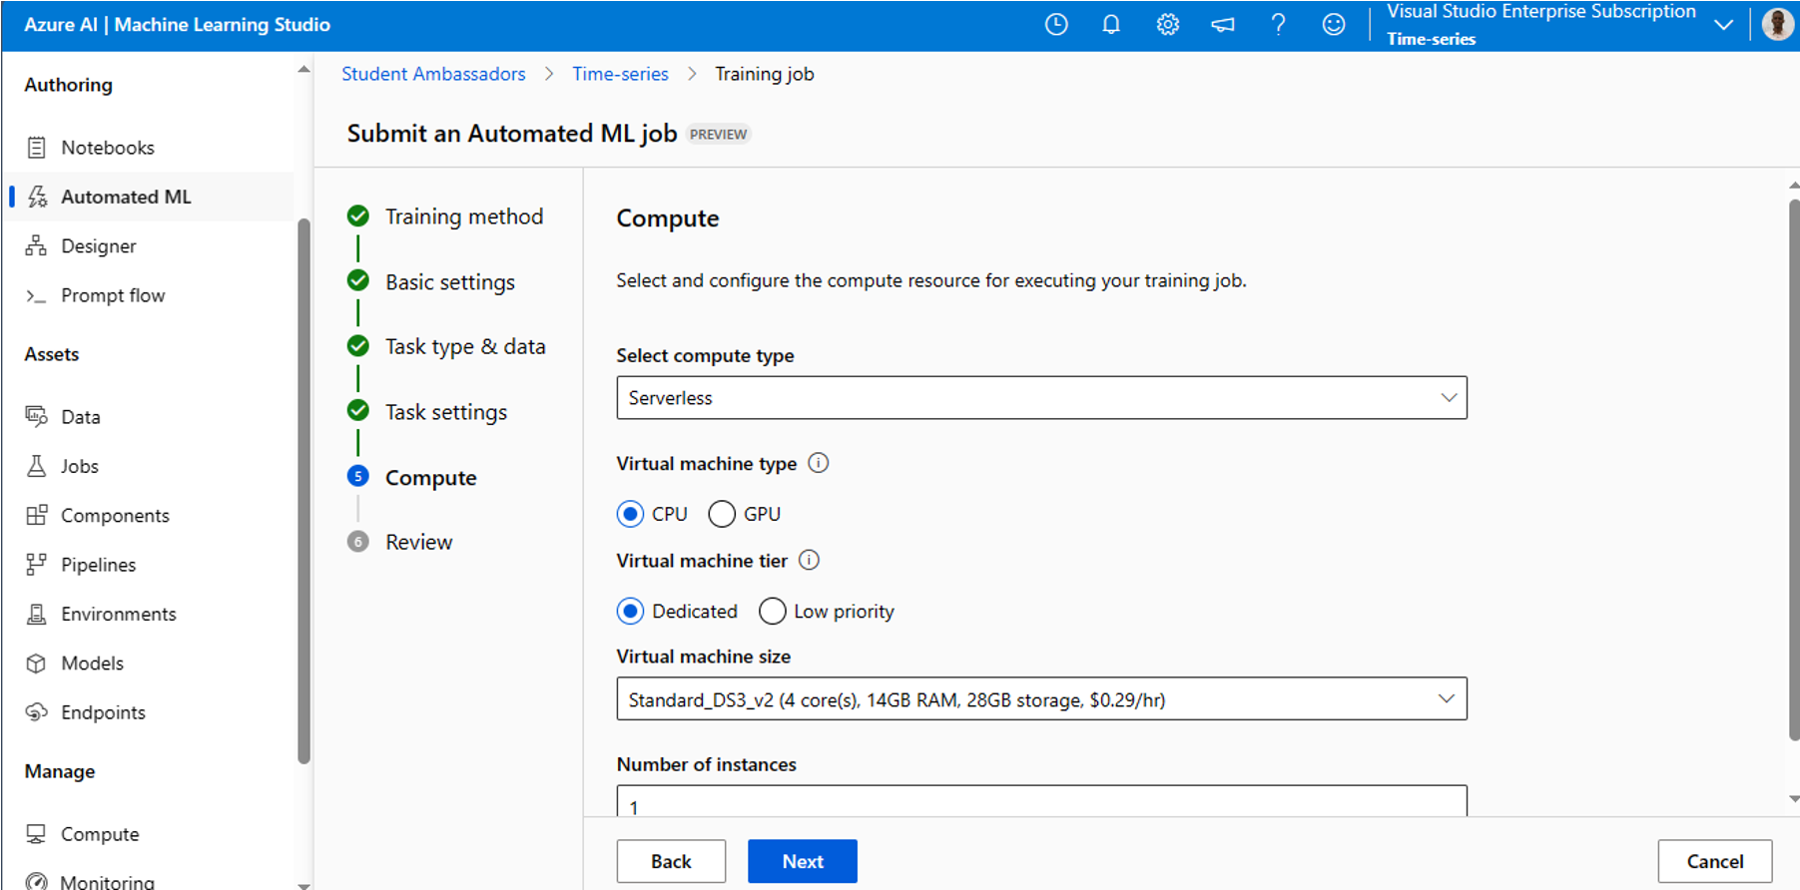
3. In the Compute section:
a. Set your compute type to Serverless (figure 19).
b. Set your virtual machine type to CPU.
c. Set your virtual machine tier to Dedicated.
d. Select any affordable but standard virtual machine size. Click Next to review the job settings.

4. In the Review section, click the Submit training job at the bottom of the screen (figure 20).

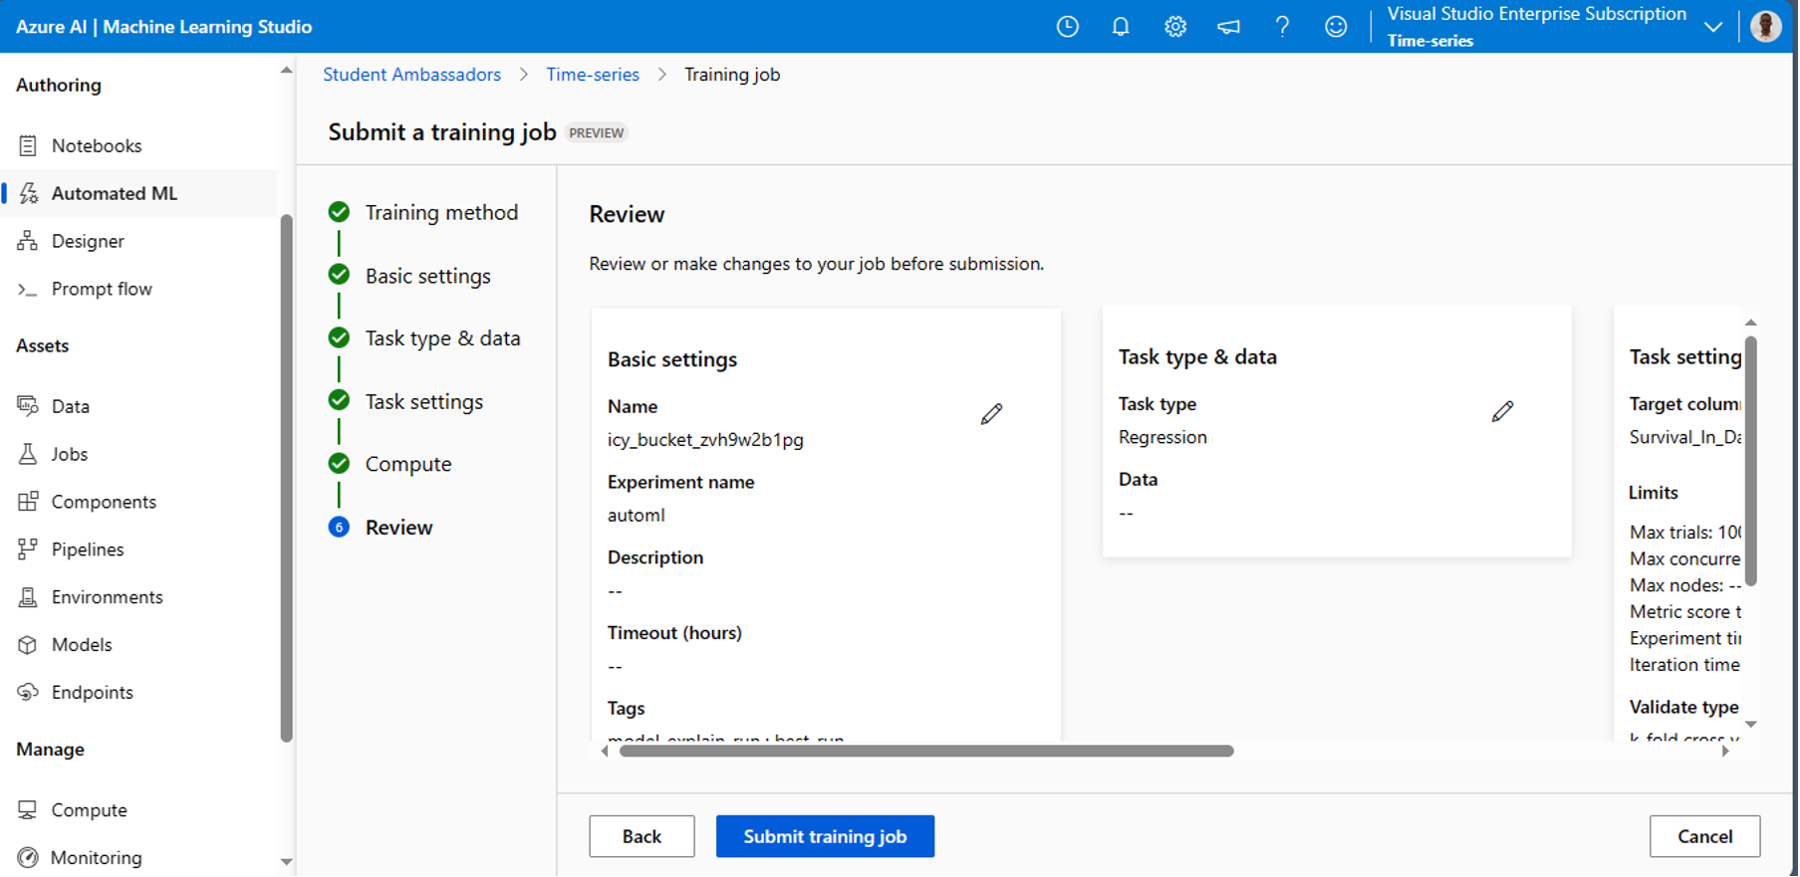
5. Wait until the Run status becomes Running on the Run Detail page (figure 21).

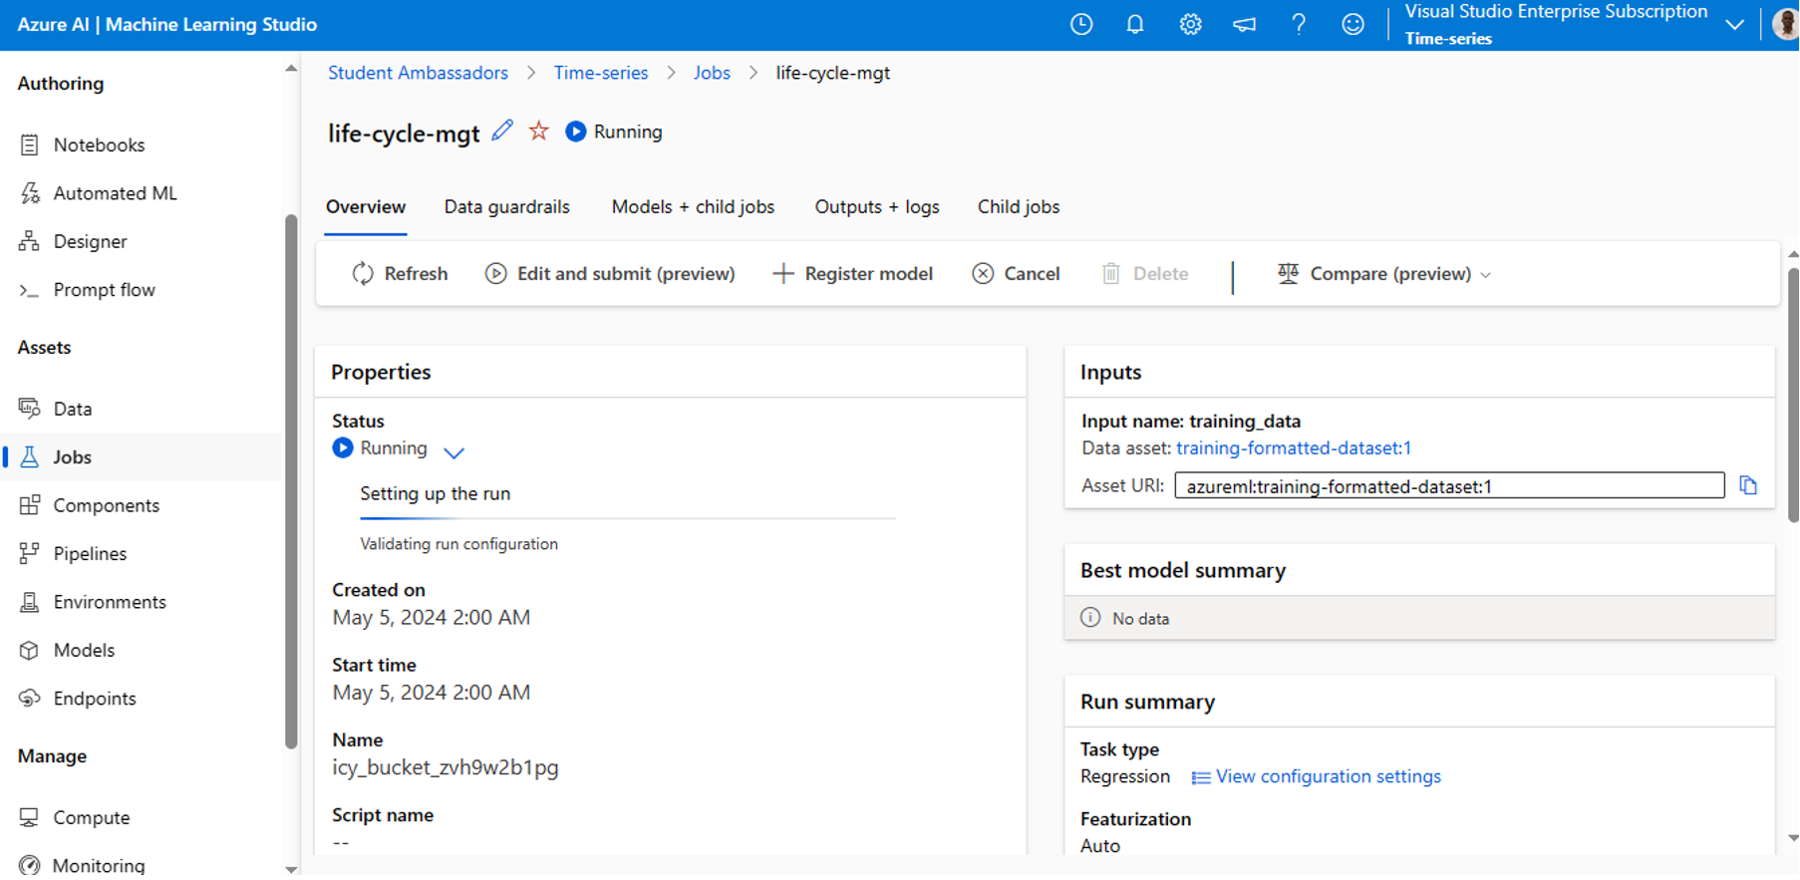
Step 5: Review the experiment run results
1. The experiment will run for about 20 minutes. While it runs and once it completes, you should check the Models + child jobs tab on the Run Detail page (see figure 22) to observe the model performance of your selected run.

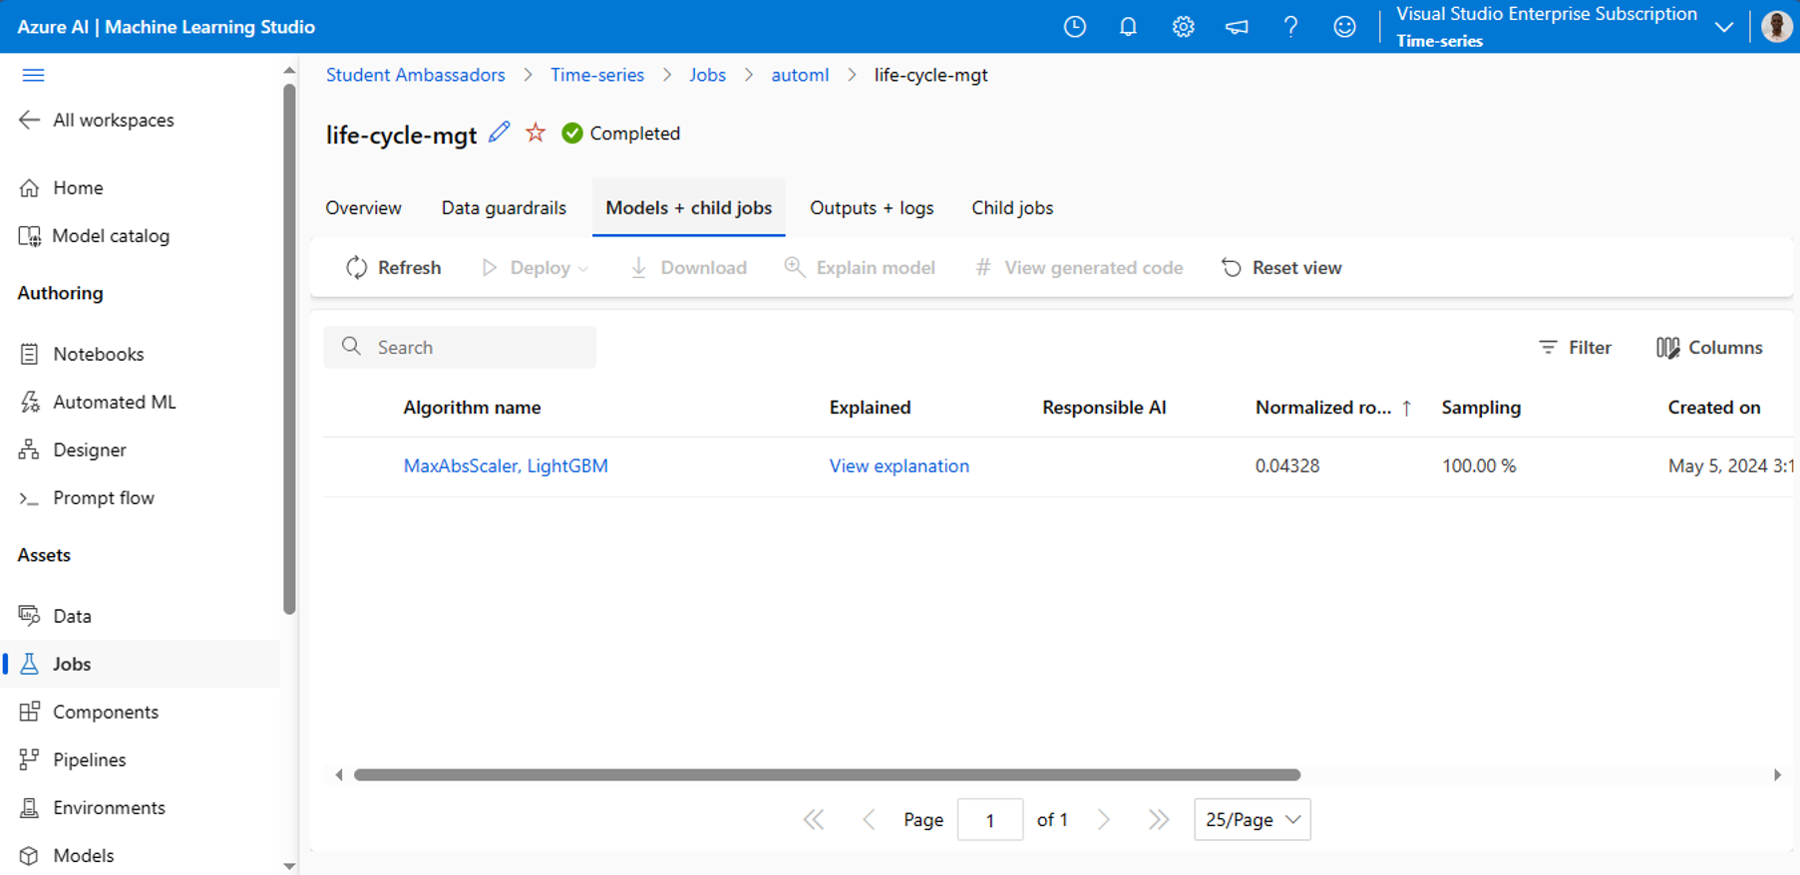
2. In the Model window, notice the Normalized root mean squared error score under the Model summary in figure 23. The normalized root mean squared error measures the error between the predicted value and the actual value. The model with the lowest normalized root mean squared error is the best. (The range is between 0 and 1.)

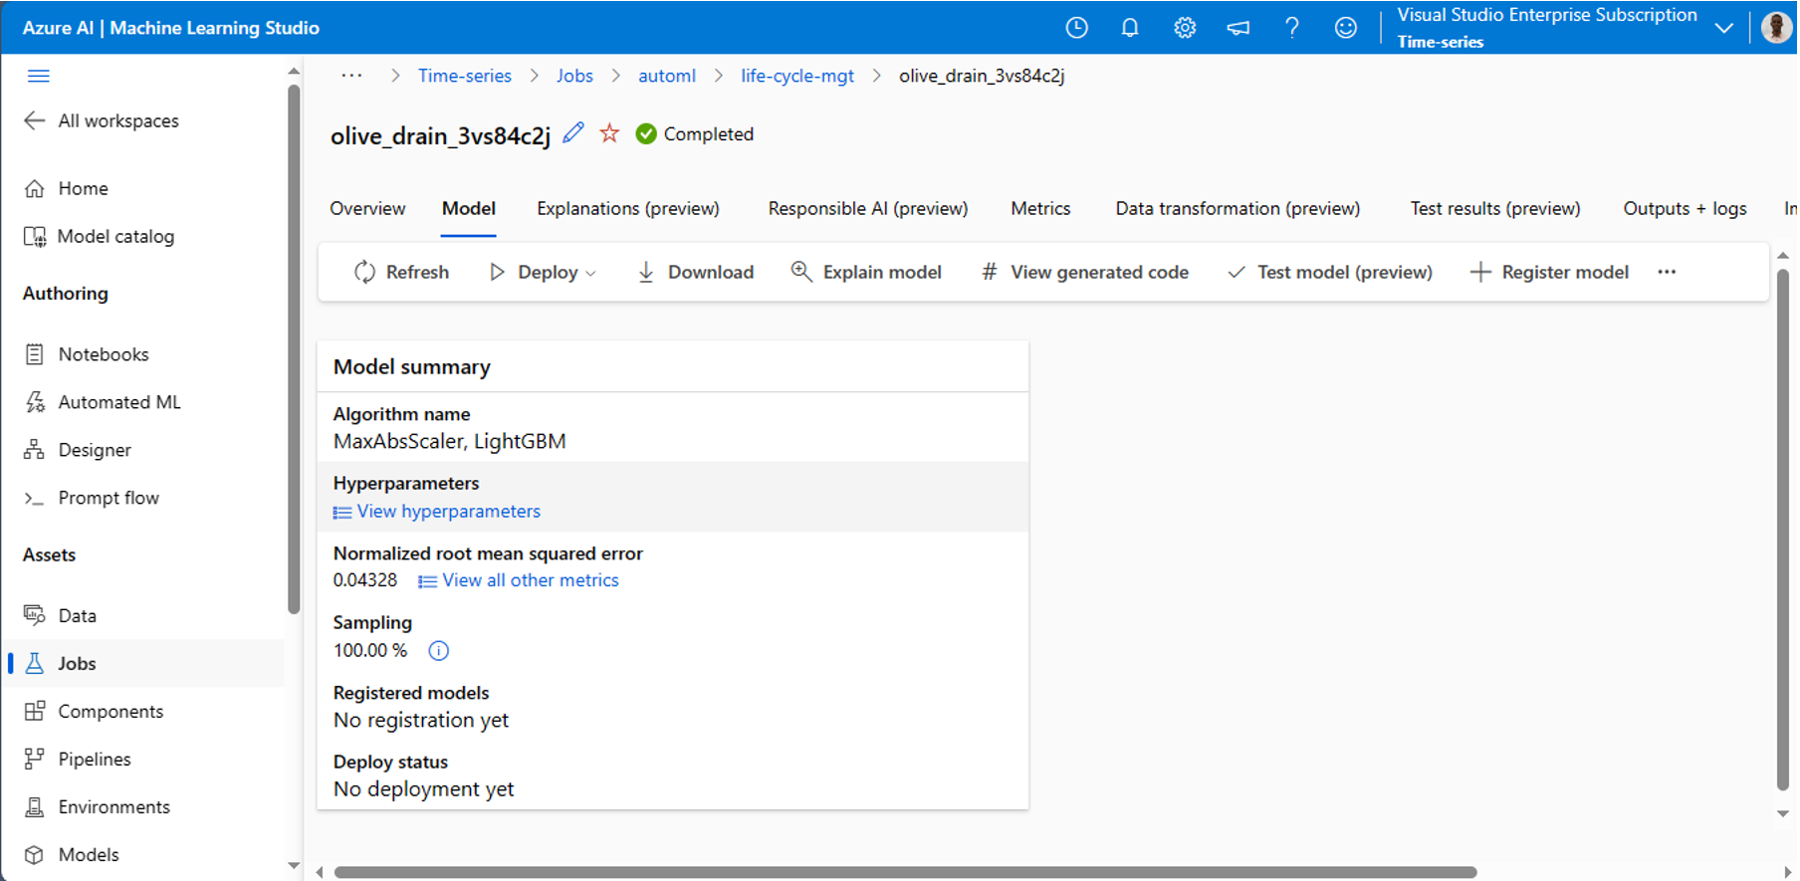
3. Click the Metrics tab on the Run detail page (figure 24) to examine the model performance for all selected metrics.

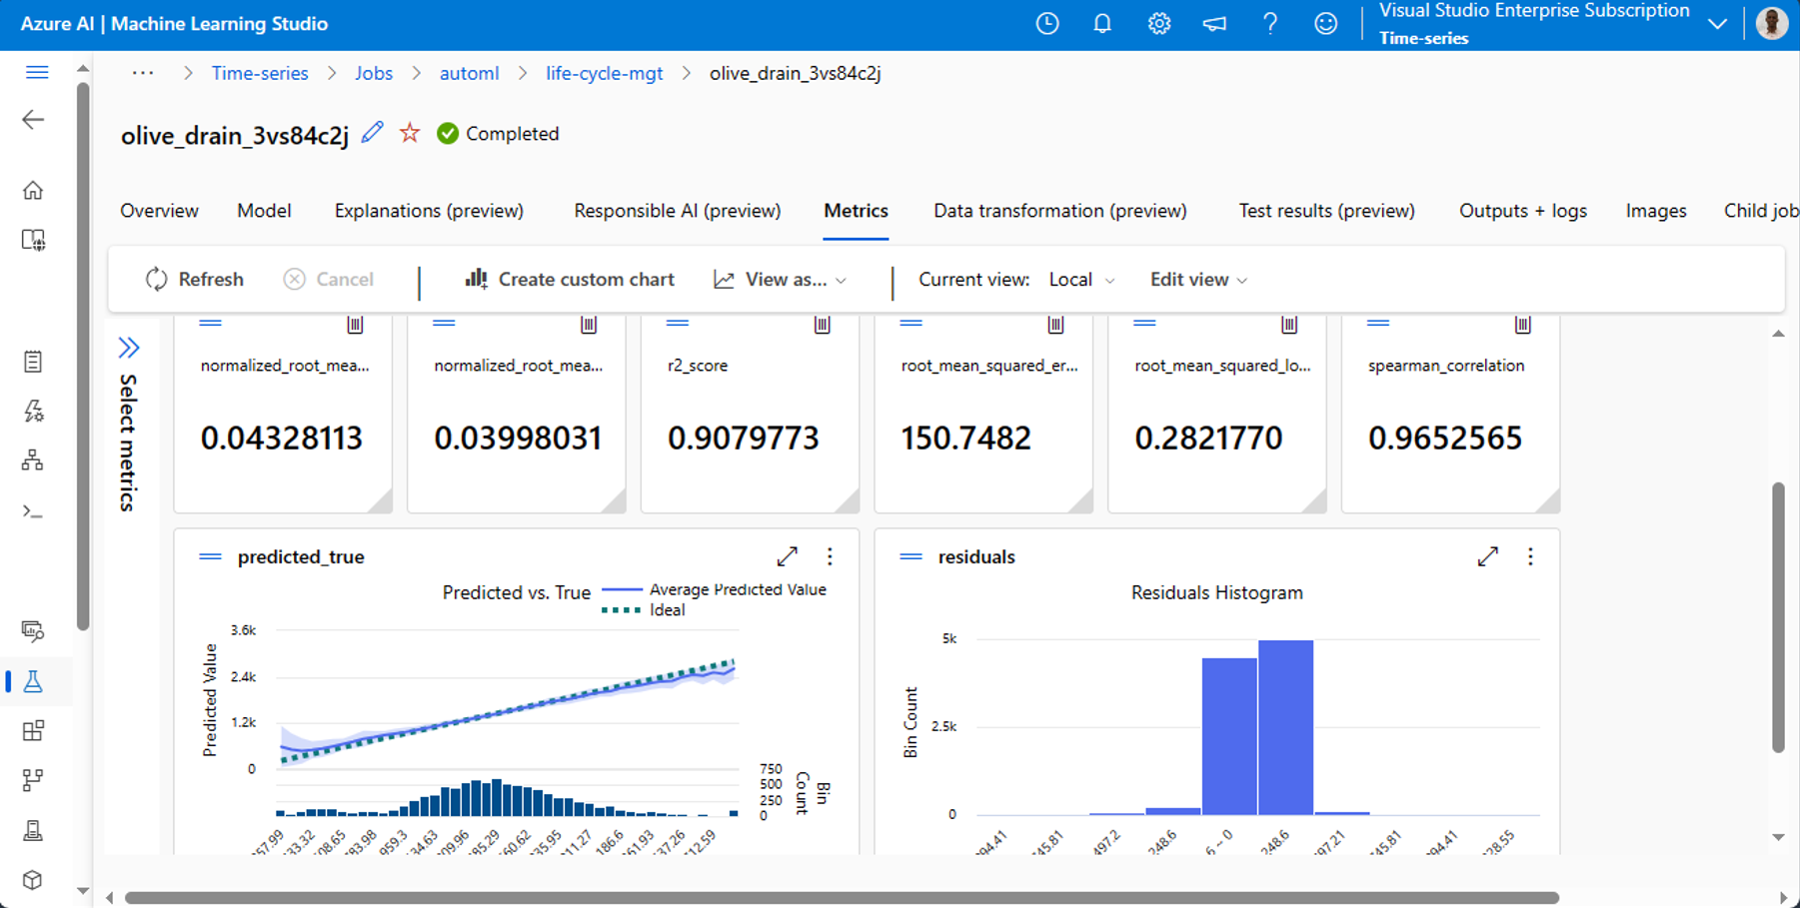
Conclusion
Training a time series forecasting model using Automated Machine Learning has the potential to revolutionize various industries, including vehicle manufacturing. By automating the process, we can create more efficient and accurate maintenance plans, leading to improved productivity and efficiency, and ensure that the vehicles we depend on are safer and more reliable. For instance, by analysing sensor data from vehicles, machine learning algorithms can predict when maintenance is required, reducing downtime, and improving overall efficiency. As we continue to explore this field, questions remain about the best ways to implement these tools and the potential for further advancements.
In this article, we have learned that the strengths of AutoML lie in its accessibility and efficiency. Embracing AutoML in Azure AI Studio is a step towards a smarter, more connected future. As we harness the power of Azure’s tools to refine our models, it is equally important to engage with communities and resources that foster growth and innovation.
For enthusiasts and professionals alike, you can leverage these resources to stay informed and inspired as you embark on your AI journey:
- Microsoft AI Discord Community is a dynamic space to discuss and share AI-related insights.
- Global AI Community offers a platform to connect with peers worldwide.
- Azure Samples provides practical code examples to enhance your projects.
- Microsoft AI Show delivers the latest updates in AI technology.
Further Reading
For deeper insights, explore the following resources:
- “Time Series Forecasting in Python” by Marco Peixeiro is a comprehensive guide that teaches you to build predictive models from time-based data. It covers statistical models and introduces new deep-learning approaches for time series forecasting. It is suitable for data scientists familiar with Python and TensorFlow.
- “Machine Learning for Time-Series with Python” by Ben Auffarth provides a thorough overview of popular Python time-series packages and modern machine-learning methods. It guides you through increasing the accuracy of your predictions by matching the right model with the right problem and mastering time series through real-world case studies. It is ideal for data analysts, data scientists, and Python developers with a basic knowledge of Python and statistics.

Paschal Alaemezie
Hi, everyone! I am Paschal Alaemezie, a Gold Microsoft Learn Student Ambassador. I am a student at the Federal University of Technology, Owerri (FUTO). I am interested in artificial intelligence (AI), software engineering, and emerging technologies, and how to apply the knowledge from these technologies in writing and building cool solutions to the challenges we face. Feel free to connect with me on LinkedIn and GitHub or follow me on X (Twitter).